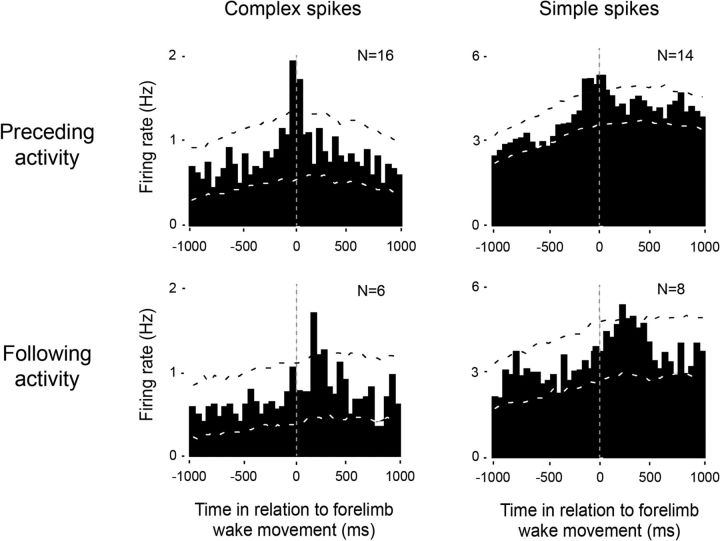
Figure 4.
Patterns of wake-movement-related complex and simple spike activity in the RN. Perievent histograms for complex spikes (left) and simple spikes (right) in relation to the onset of the first forelimb movement during a bout of wakefulness. Top row, Data pooled across all units that significantly preceded forelimb movements. Bottom row, Data pooled across all units that significantly followed forelimb movements. Vertical dashed lines correspond to movement onset. Number of units included in each analysis is indicated in each plot. Upper and lower confidence bands (p < 0.01 for each band) are indicated by the black and white dashed lines, respectively.

