Figure 5.
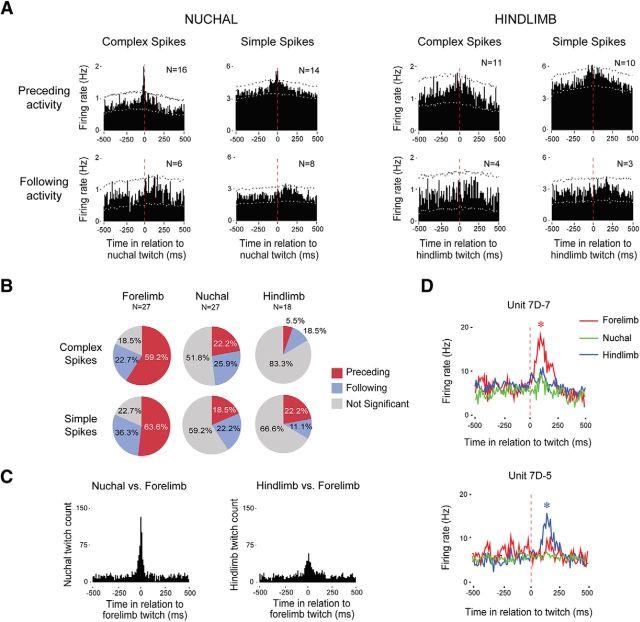
Somatotopic organization of twitch-related activity in the RN. A, Perievent histograms depicting unit activity in relation to contralateral nuchal (left) and hindlimb (right) twitches. Each histogram was created using pooled data from units that exhibited significant activity in relation to forelimb twitches (see Fig. 3). Vertical dashed lines correspond to twitch onset. Number of units included in each analysis is indicated in each plot. Upper and lower confidence bands (p < 0.01 for each band) are indicated by the black and white dashed lines, respectively. B, Percentage of units exhibiting significant or nonsignificant twitch-related activity for each muscle group. C, Perievent histograms showing the number of nuchal (left) and hindlimb (right) twitches in relation to forelimb twitches for those subjects with EMG data from all three muscle groups (N = 5). D, Perievent line histograms relating activity in two adjacent units to twitches in the contralateral forelimb muscle (red), contralateral nuchal muscle (green), and hindlimb muscle (blue). Vertical dashed lines correspond to twitch onset. Asterisks indicate significant peaks in unit firing rate, p < 0.01.

