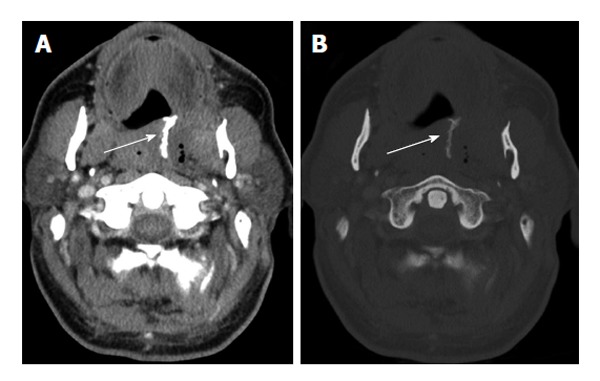
Figure 2.

Axial computed tomography images from a scan performed 2 d after surgical exploration are shown, displayed in (A) soft tissue and (B) bone windows. The images demonstrate post-treatment changes with fluid and gas in the left palatine tonsil and peritonsillar region. In addition, there is a radiodense structure (arrow) in the pharyngeal mucosal space of the oropharynx and soft palate with density similar to bone, corresponding to the region of silver nitrate application. Note the absence of normal bone architecture such as cortex and medulla.
