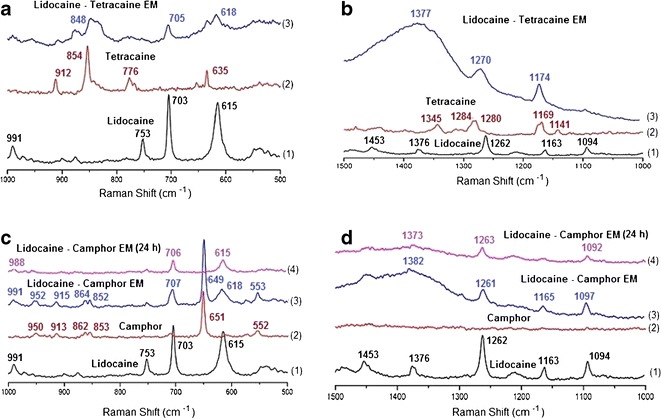
Fig. 8.

Raman spectra of the eutectic mixture of lidocaine and tetracaine (a-b) and eutectic mixture of lidocaine and camphor (c-d) in comparison to the spectra of each drug. Spectra from wavenumber 500 to 1000 cm−1 (a and c) and from 1000–1500 cm−1 (b and d)
