
Fig. 5.
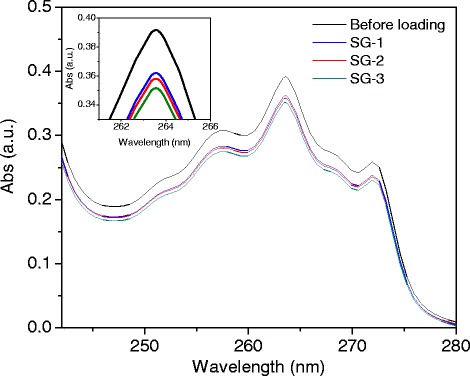
UV absorption spectra of the ibuprofen–hexane solution before (black line) and after loading SG-1, SG2, and SG-3 samples. Loading of ibuprofen in the porous structures is clear from the reduction of absorption intensity (inset). The inset shows the magnified portion of the spectra around 263-nm absorption band of ibuprofen