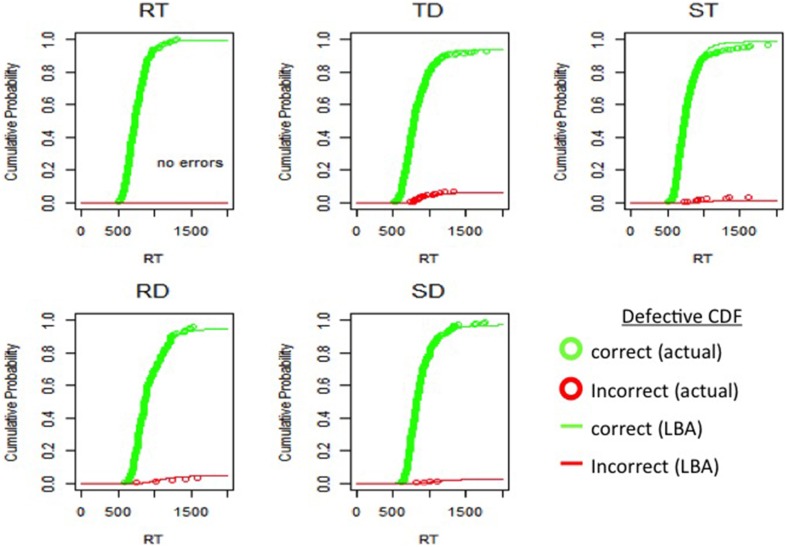
Figure 4.
Example subject's defective cumulative density functions illustrating the probability of observing correct (green font) and incorrect (red font) responses on or before some response time (RT). Subject's actual (open circles) data LBA simulated (lines) data plotted against each other for RT, redundant target; TD, mixed target/distractor; RD, redundant distractor; ST, single target; SD, single distractor conditions.

