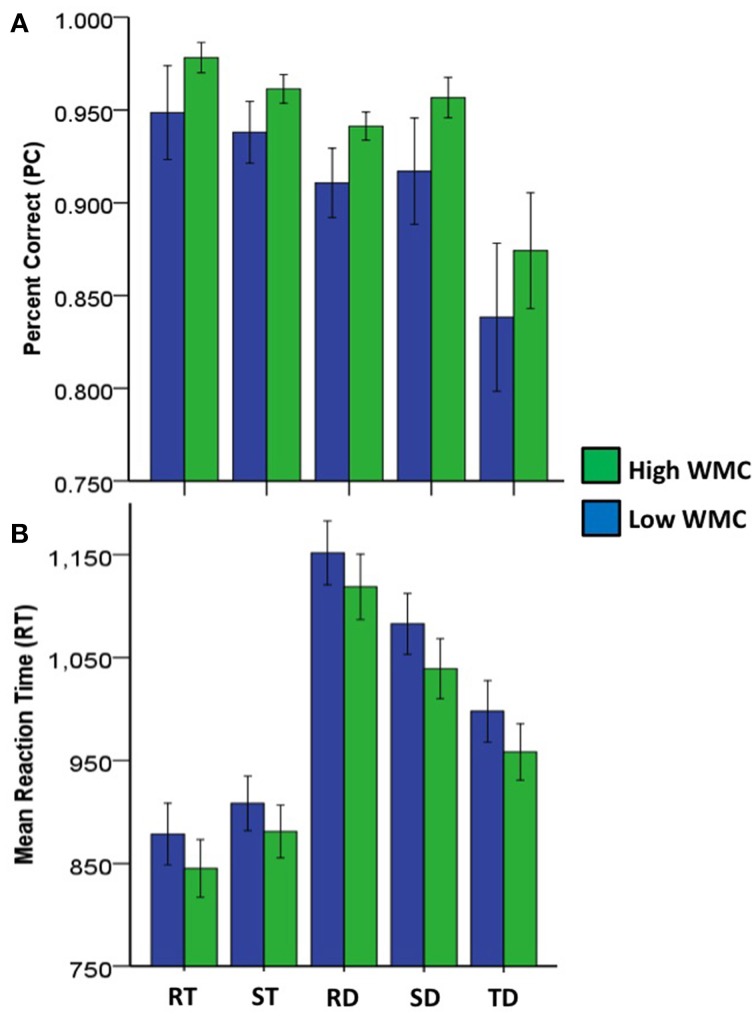
Figure 5.
Bar graphs with 95% confidence intervals for mean accuracy (A) and response time (B) by redundancy condition and working memory capacity (WMC) groupings. RT, redundant target; TD, target and distractor; DT, distractor and target; RD, redundant distractor; ST, single target; SD, single distractor.

