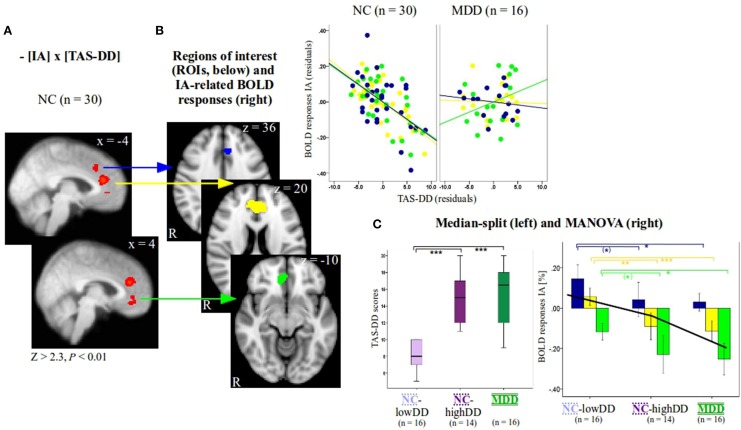
Figure 1.
(A) Individual group slope for non-psychiatric controls (NC, n = 30, Z > 2.3, P < 0.01, x-coordinates are given in MNI space) as a function of TAS-DD scores. Group differences of IA-related activity between NC and patients with major depressive disorder (MDD) as a function of TAS-DD scores and individual results investigating MDD (n = 16, Z > 2.3, P < 0.05) can be seen in Supplementary Figure 1A. To visualize the negative relationship between IA-related activity and TAS-DD scores in NC, signal changes of the three medial-frontal regions (see B) were plotted against TAS-DD scores (values depict residuals since corrected for the amount of gray matter). (B) Three regions of interest (blue, yellow, and green ROI) were defined according to significant results as a function of TAS-DD scores seen in (A) (n = 30 NC). Z-coordinates are given in MNI space. (C) The group of NC (n = 30) was divided on the basis of a median-split into two subgroups, those with high (NC-highDD, n = 14) and those with low TAS-DD scores (NC-lowDD, n = 16). The three groups (NC-lowDD, NC-highDD, MDD) were defined as between-subjects factor when calculating MANOVA. TAS scores, BOLD responses of interoceptive and exteroceptive awareness (IA, EA), the amount of gray matter within the ROIs and age were defined as dependent within-subjects variables. Post-hoc tests (Bonferroni corrected) revealed no differences of TAS-DD scores between NC-highDD and MDD. Both groups differed significantly compared to NC-lowDD [see boxplots on the left hand side of (C) and Table 1B]. IA-related BOLD responses show a similar pattern. No differences occurred between high-alexithymic participants (NC-highDD and MDD), whilst both groups differed significantly to NC-lowDD (see bar diagram on right hand side of (C) and Table 1B for details; values show mean ± 95% confidence intervals). Please note that the color code of bars corresponds to the color of each ROI and to the colors used in Table 1B. The black line in bar diagram (C) shows mean IA-related BOLD responses of all participants per region, ranging from the blue to the yellow and green ROI (independent of group, see also Supplementary Table 2). ANOVA (Supplementary Table 2) revealed a significant effect of region. *** indicates P < 0.0001, ** indicates P < 0.001, * indicates P < 0.05, (*) indicates P < 0.1.

