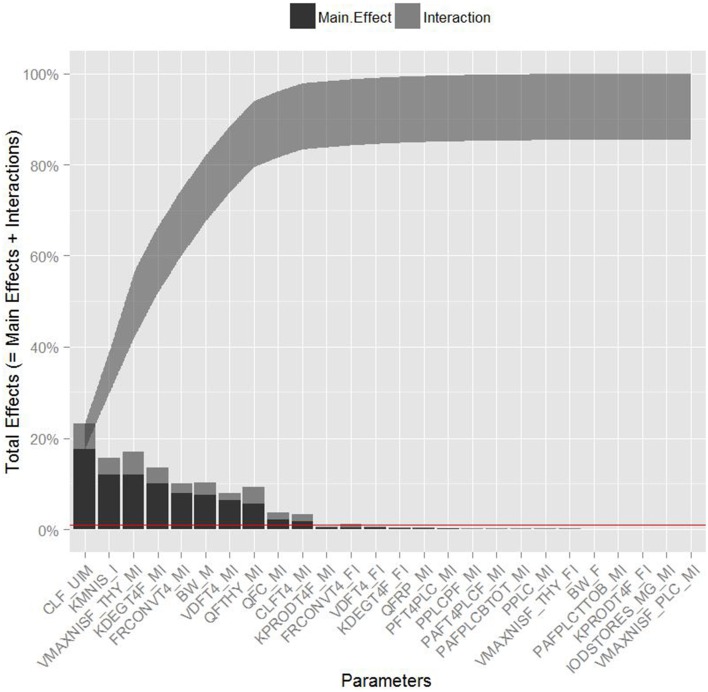
Figure 4.
Lowry plot of the quantitative global sensitivity analysis results of Gaussian Emulation processes. The total effect of a parameter comprised the main effect (black bar) and any interactions with other parameters (gray bar) given as a proportion of variance. The ribbon, representing variance due to parameter interactions, is bounded by the cumulative sum of main effects and the minimum of the cumulative sum of the total effects for model predicted levels of maternal free thyroxine levels at steady state. Red line denotes the model parameters with variances and/or total effect greater than 0.5%.

