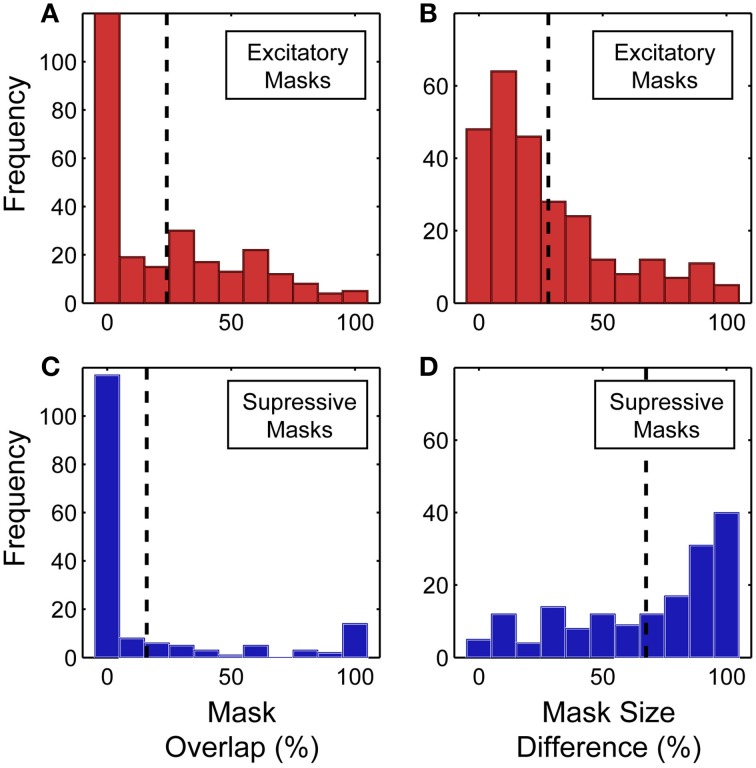
Figure 9.
(A,B) Overlap between the excitatory component of the predicted and measured spike-triggered masks. Relative size difference between the excitatory component of the predicted and measured spike-triggered masks. (C,D) Overlap between the suppressive component of the predicted and measured spike-triggered masks. Relative size difference between the suppressive component of the predicted and measured spike-triggered masks. Percentage calculated relative to the largest of each mask pair. Dashed lines indicate the mean of each distribution.

