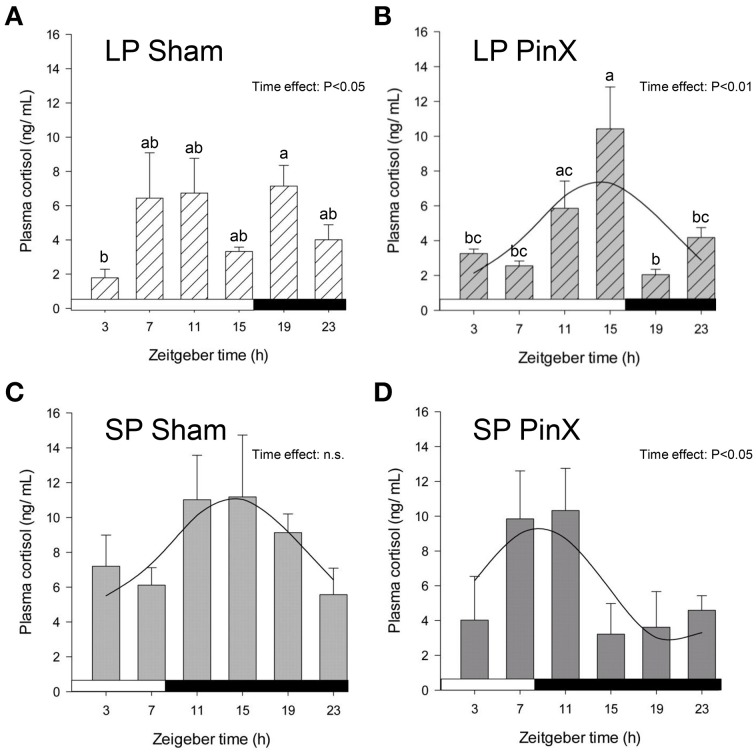
Figure 1.
Effects of photoperiod and pinealectomy on daily variations of plasma cortisol in the Syrian hamster. Light and dark bars represent photoperiod and scotoperiod, respectively. LP, long photoperiod (16 h light/08 h dark) (A,B); SP, short photoperiod (08 h light/16 h dark) (C,D); Sham, sham-operated hamsters (A,C); PinX, pinealectomized hamsters (B,D). Fitted curves represent significant cosinor analyses (for details, see Materials and Methods and Table 2). The absence of a curve in the LP Sham panel indicates that the daily variations of cortisol are not significant in these conditions. The inset for each graph indicates the effect of Zeitgeber time, evaluated by One-Way ANOVAs or ANOVAs on ranks when normality test (Shapiro-Wilk) failed; n.s., non-significant. For a given panel, histograms lacking common letters are significantly different (P < 0.05).

