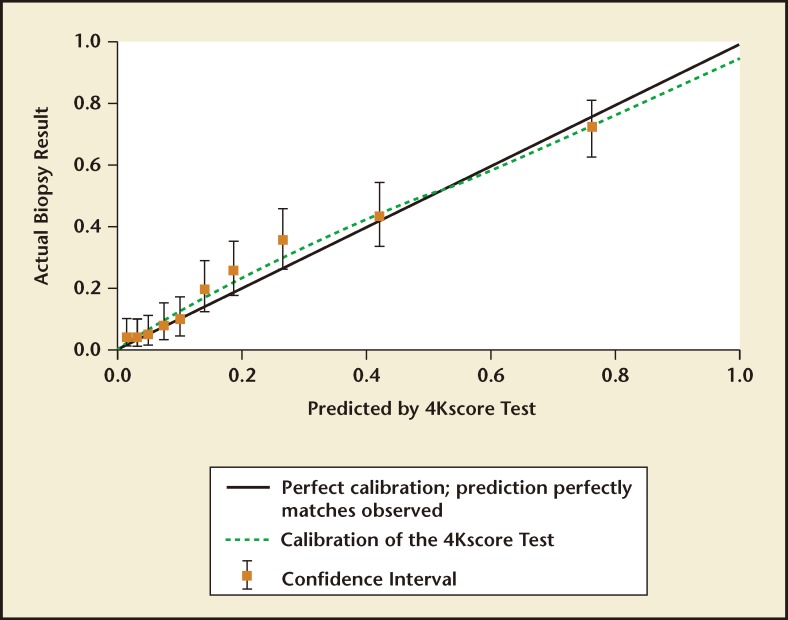
Figure 3.
A calibration plot showing the risk for Gleason score ≥ 7 prostate cancer predicted by the 4Kscore Test® (OPKO Lab, Nashville, TN) compared with the actual prostate biopsy results. Data are from the US Validation Study. Perfect calibration is noted by the solid black line; the green line displays the calibration of the 4Kscore Test. The results show near perfect correlation between the risk predicted by the 4Kscore Test versus actual risk for high-grade prostate cancer determined by biopsy. Adapted from Parekh D et al.36

