
Figure 4.
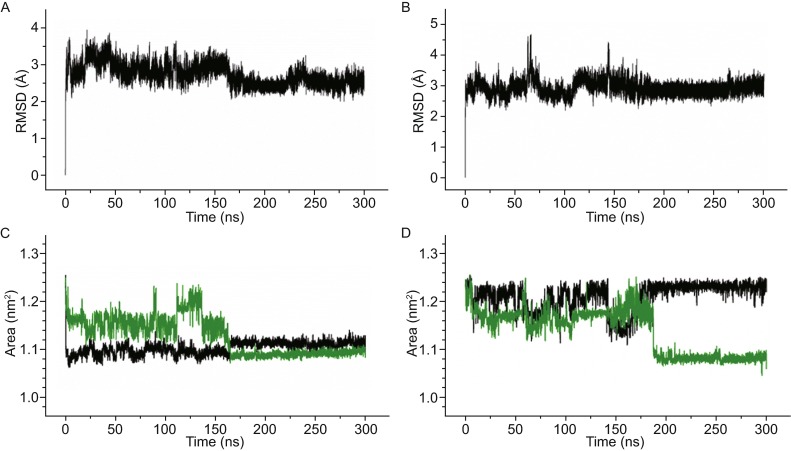
The RMSDs and the fluctuations of G-tetrad gate areas. (A and B) represent the RMSDs of sim-K1 and sim-K2, respectively; (C and D) represent the fluctuations of G-tetrad gate areas, in which the top and bottom gate area were shown as black and green lines, respectively