
Figure 6.
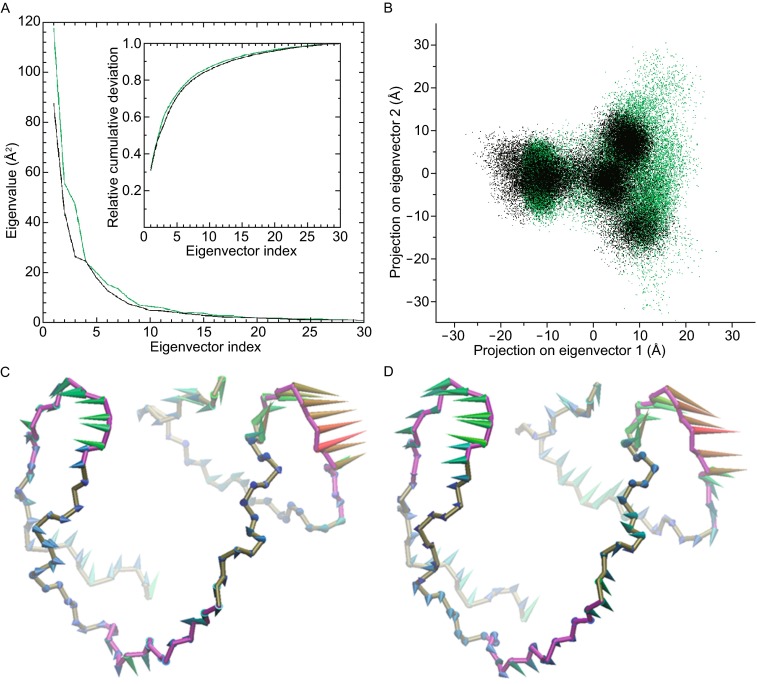
Principal component analysis. (A) Eigenvalue profiles constructed by the first 30 eigenvectors from PCA analysis of sim-K1 and sim-K2, which were represented by black and green lines, respectively. (B) two-dimensional projection of backbone atomic trajectories along the first two eigenvectors, projections in sim-K1 and sim-K2 were represented by black and green dots, respectively. (C and D) respectively show the dominant motions along the first eigenvector in sim-K1 and sim-K2 by porcupine plot