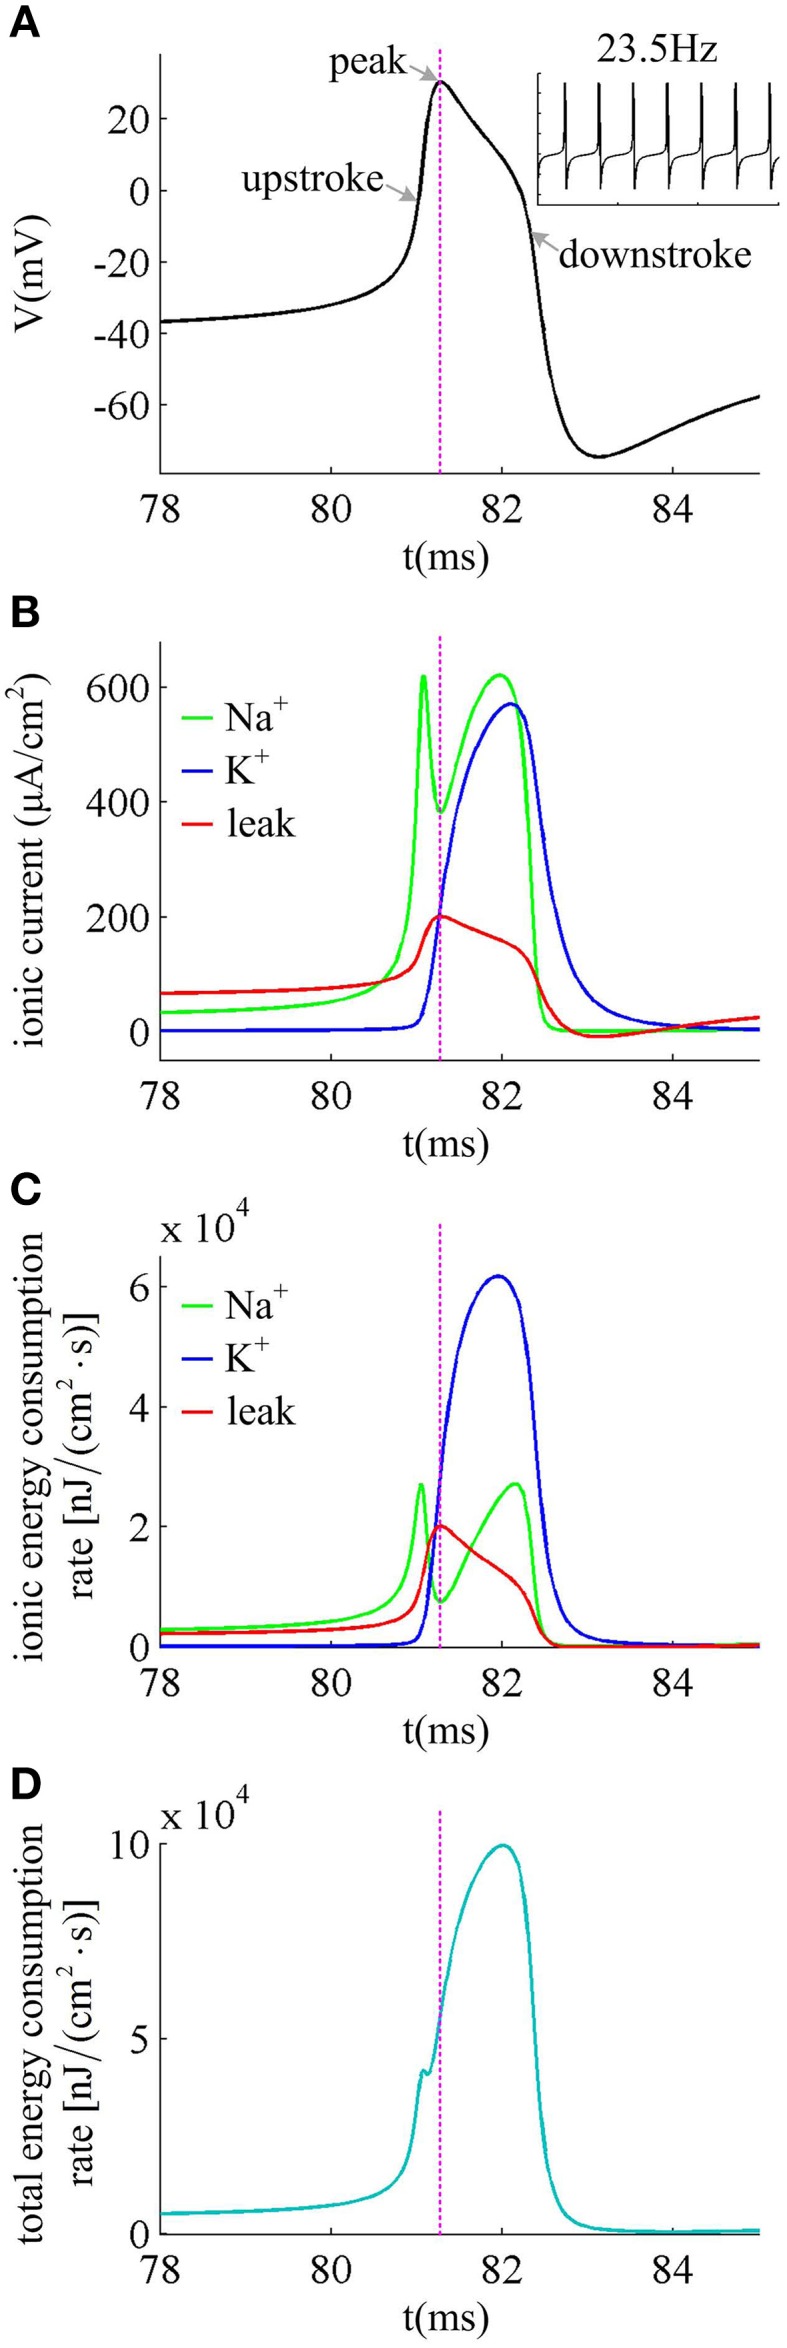
Figure 6.

Ionic currents and energy consumption involved in a spike. (A) shows an action potential generated in the neuron with βn = −5mV. (B) gives the Na+, K+ and leak currents in this action potential. The Na+ current is negative but we plot it with a positive sign. (C) shows the energy consumption rate for each ionic current, and (D) gives the total energy consumption rate of the action potential. The stimulus is Iin = 37.5μ A/cm2 and σ = 0μ A/cm2. In this case, the neuron generates repetitive spiking at about 23.5 Hz.
