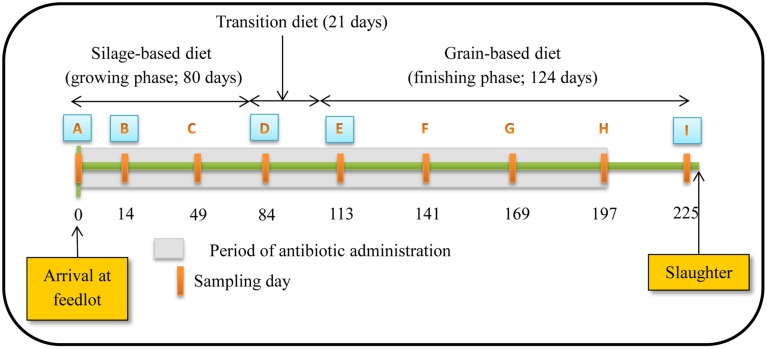
Figure 1.
Schematic representation of experiment timeline (Figure reproduced from Sharma et al., 2008). Numbers indicate day of feeding period. Periodic orange rectangles indicate points where fecal samples were collected from steers. A, B, D, E and I represent points where isolates were selected for assessing antibiotic susceptibility, PFGE profiles and identifying resistance determinants. Grey shaded area represents the period that tylosin was administered in the diet.

