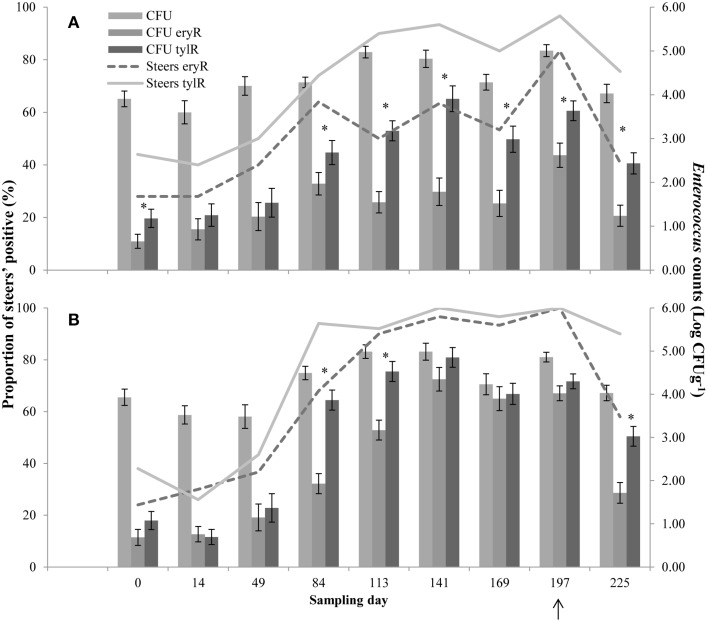
Figure 2.
Proportion of steers positive for eryR enterococci (Steers eryR) or tylR enterococci (Steers tylR) and Enterococcus counts (log CFUg−1) of, total population (CFU), eryR enterococci (CFU eryR) or tylR enterococci (CFU tylR) for CON (A) or T11 (B) treatments. Arrow indicates when antibiotics were withdrawn from the diet. An “*” indicates days for which there was a significant difference between eryR and tylR Enterococcus counts (P < 0.05). For each treatment (day 0, 14, 84, 113, and 225 n = 50; day 49, 141, 169, and 197 n = 30).

