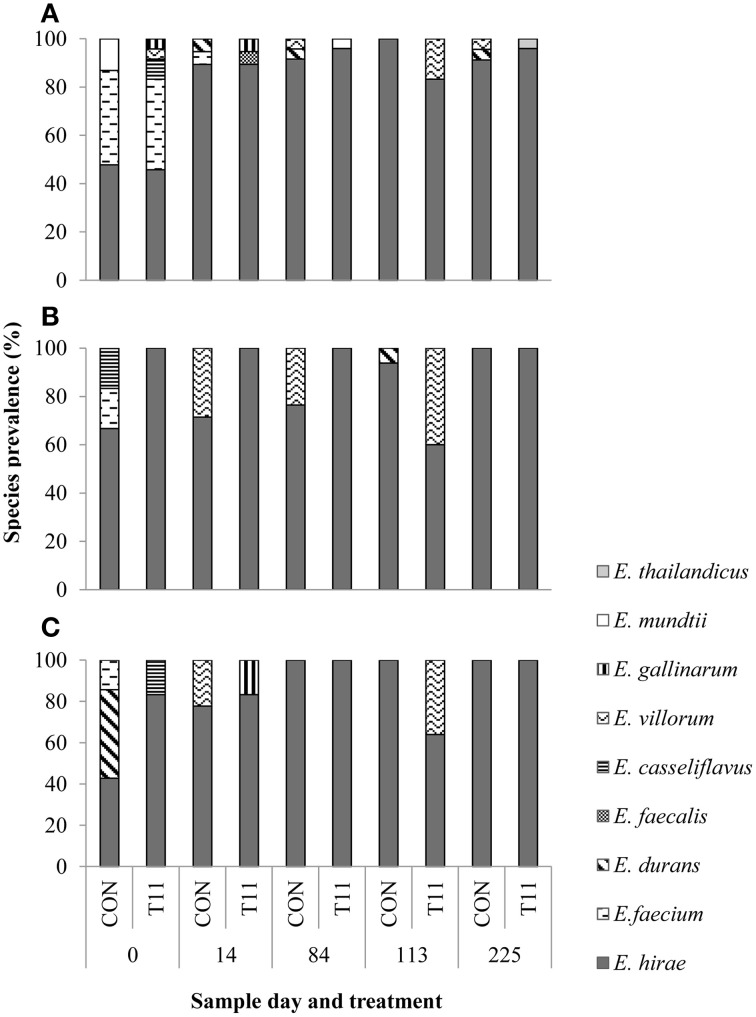
Figure 4.
Species distribution of characterized isolates from (A) BEA (bile esculin azide agar), (B) BEAE (bile esculin azide agar amended with erythromycin [8 μg/mL]) and (C) BEAT (bile esculin azide agar amended with tylosin [32 μg/mL]). Prevalence was calculated by dividing the number of isolates for each species by the total number of isolates from each sample day and treatment.

