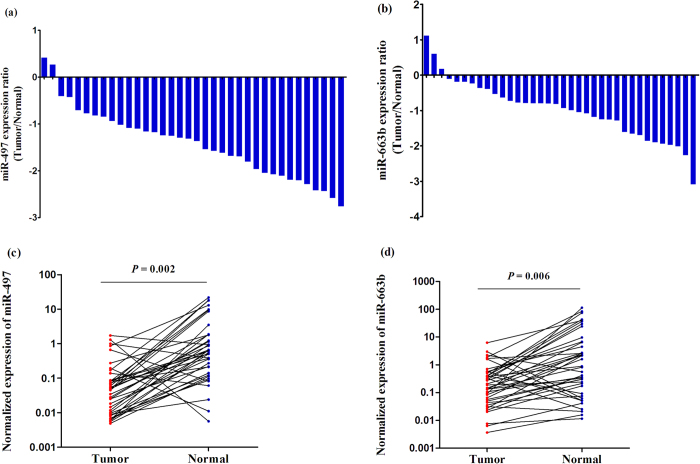
Figure 3.
The miRNAs expressions in 36 BC tissues and adjacent non-malignant tissue samples. Logarithm of the ratio of (a) miR-497 and (b) miR-663b expression levels between tumor and normal tissues. Scatter plots of tissue levels of (c) miR-497 and (d) miR-663b in BC and its adjacent normal tissues, analyzed by the Wilcoxon signed rank test.

