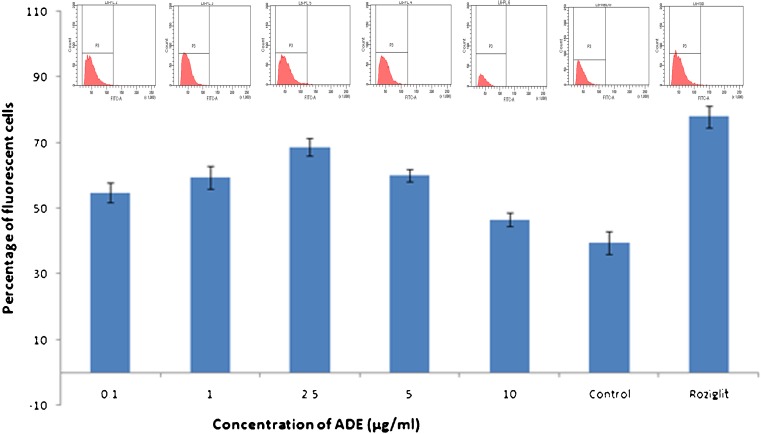
Fig 3.
2-NBDG uptake assay: Percentage of cells that showed fluorescence of 2-NBDG with and without ADE treatment was measured using flow cytometer. Bar diagram showing percentage of cells showing fluorescence. Corresponding histogram generated upon flow cytometric analysis is also shown above bar graph. Experiment was carried out in triplicate and values expressed as mean ± SD

