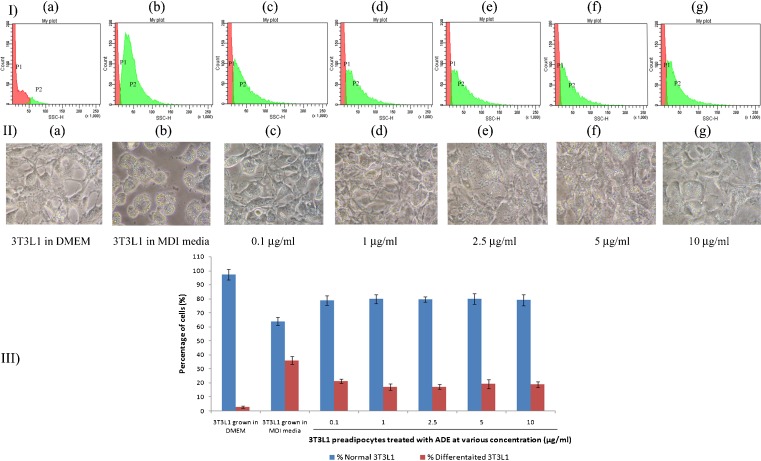
Fig 4.
Hypolipidemic effect of ADE at various concentrations were measured based on size and granularity of cells using flow cytometer. I) a-g: Histogram from FACS data showing change in differentiated 3T3L1 population (P2). II) a-g: Figures clearly visualize the change in lipid droplets content in control and treated samples. III) Graph showing change in percentage of normal and differentiated cells in the presence of ADE

