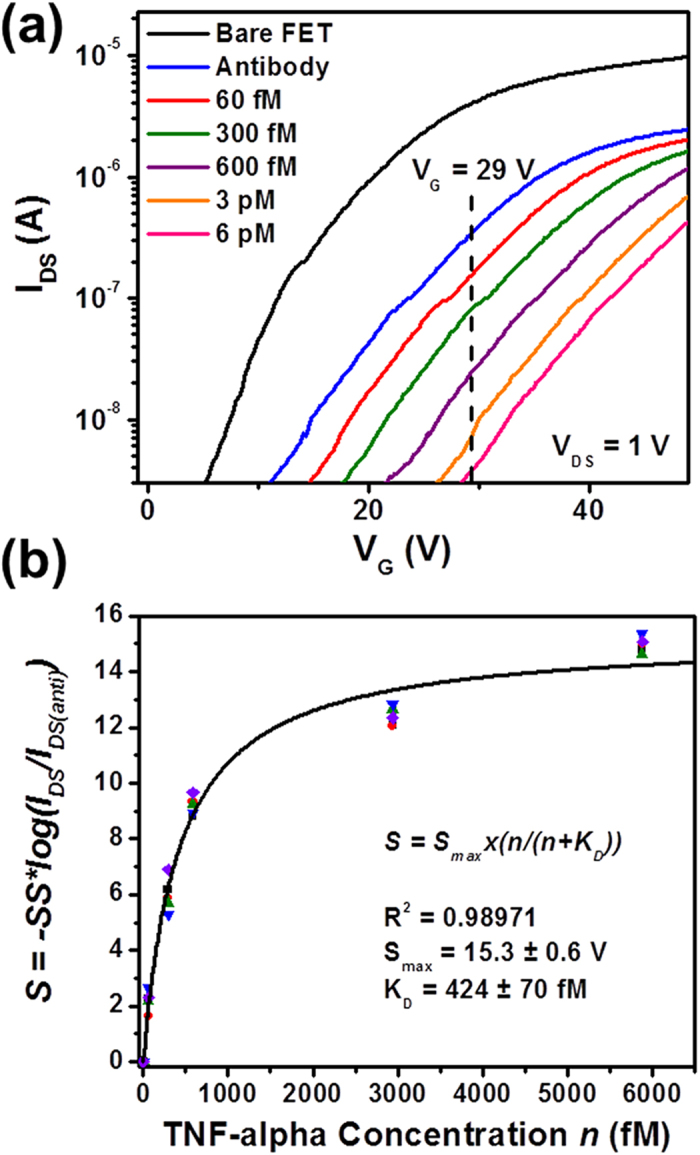
Figure 4.

Sensor responses measured in the subthreshold regimes of MoS2 transistor biosensors: (a) transfer characteristics of an exemplary MoS2 transistor sensor measured at various biodetection stages, following the sequence of (1) bare transistor, (2) antibody functionalization, and inputs of TNF-α solutions with concentrations of (3) 60 fM, (4) 300 fM, (5) 600 fM, (6) 3 pM, and (7) 6 pM (Here IDS data are plotted in the logarithm scale, and the subthreshold regimes are emphasized); (b) a set of calibrated subthreshold-regime responses (S) measured from five different MoS2 transistor sensors with respect to TNF-α concentration (n). These S-n relationships can be well fitted with Langmuir isotherms and the dissociation constant (KD) of the antibody-(TNF-α) pair is extracted to be 424 ± 70 fM.
