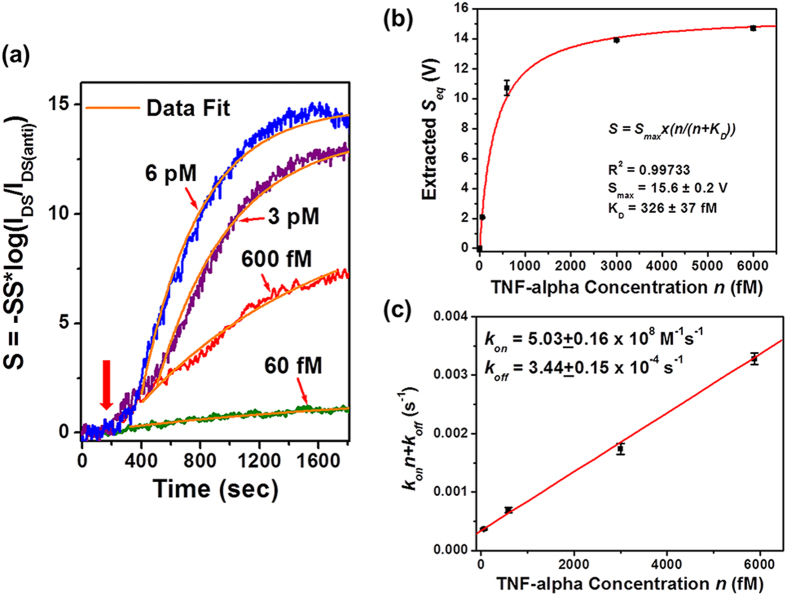
Figure 6.
Time-dependent association kinetics of the antibody-(TNF-α) pair: (a) real-time sensor responses of antibody-(TNF-α) binding measured under different TNF-α concentrations (n = 60 fM, 600 fM, 3 pM, and 6 pM). Each of the response curves was measured from a different MoS2 transistor sensor and all responses were normalized using Equation (5). The rise parts of the binding response curves can be fitted with Equation (6). (b) The equilibrium-state responses (Seq) extracted from this fit plotted as a function of TNF-α concentration, which can be further fitted with Langmuir isotherm. The equilibrium constant (KD) is extracted to be 326 ± 37 fM. (c) The extracted (konn + koff) data plotted as a function of TNF-α concentration (n). The linear fitting of this (konn + koff)-versus-n graph results in rate constants of kon = (5.03 ± 0.16) × 108 M−1 s−1 and koff = (3.44 ± 0.15) × 10−4 s−1.

