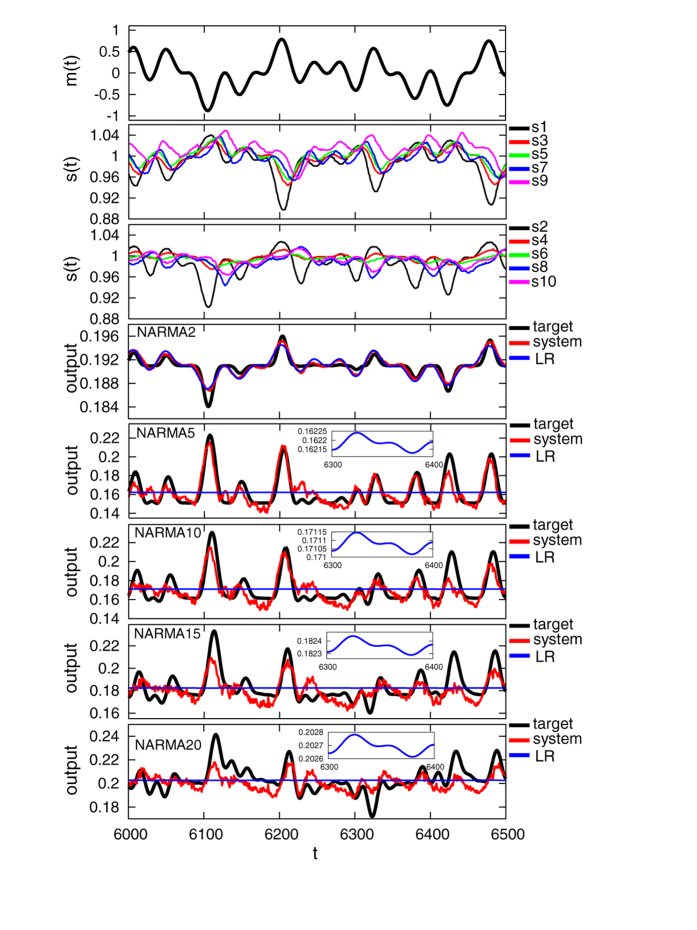
Figure 2. A typical example of the task performance in terms of time series when T = 400 in the evaluation phase.
From the upper to the lower plots, the time series of the motor command, the corresponding sensory values (odd-numbered sensors and even-numbered sensors), and the outputs for NARMA2, NARMA5, NARMA10, NARMA15, and NARMA20 are depicted. For each plot of the output, the time series for the system output as well as the target output and the output for the LR model is overlaid for comparison. Note that the output of the LR model, especially in NARMA5, NARMA10, NARMA15, and NARMA20, is not a constant but a scaled version of the input with an offset (see the inset that scales up the output for the LR model from timestep 6300 to 6400 in each plot).

