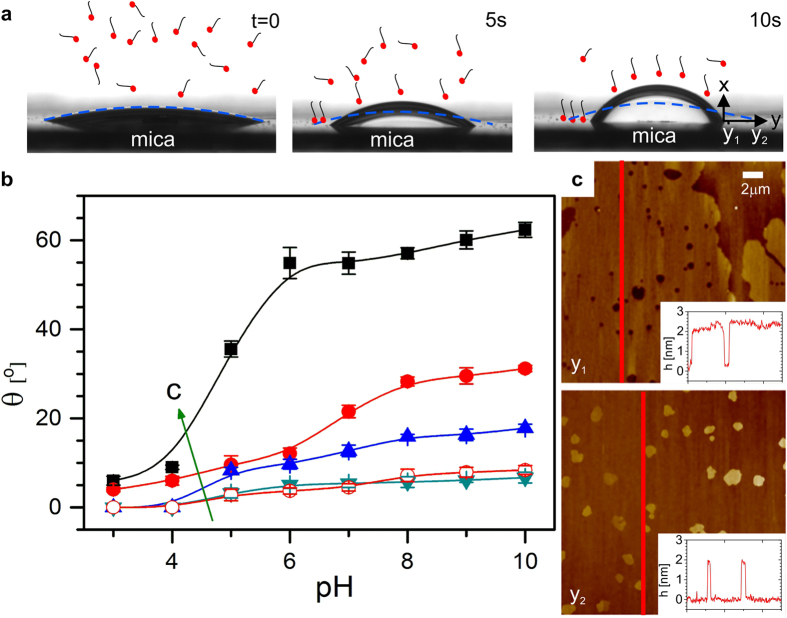
Figure 4. Cation-induced surfactant adsorption on solid substrate in oil.
(a) Snapshots of drops of 1 M CaCl2 solution (pH = 9) on mica immersed in ambient decane containing 100 μM stearic acid, immediately after deposition (t = 0) and 5 s and 10 s later. Drops display autophobic behavior due to the deposition of organic layers on the substrate. (b) Equilibrium contact angle vs. pH for various concentrations of CaCl2: 1 mM (cyan downward triangles), 10 mM (blue upward triangles), 100 mM (red circles), 1 M (black squares) and NaCl: 100 mM (red open circles). The arrow with the letter c denotes the direction of increasing salt concentration. Stearic acid concentration: 100 μM. (c) After drop removal and drying AFM images display an almost complete monolayer at a distance of y1 = 100 μm from the original contact line and an almost bare substrate with occasional stearate islands at y2 = 800 μm. Height profiles, corresponding to the red lines in the AFM images, demonstrate that the thickness of the layer corresponds to the length of a stearate monolayer.

