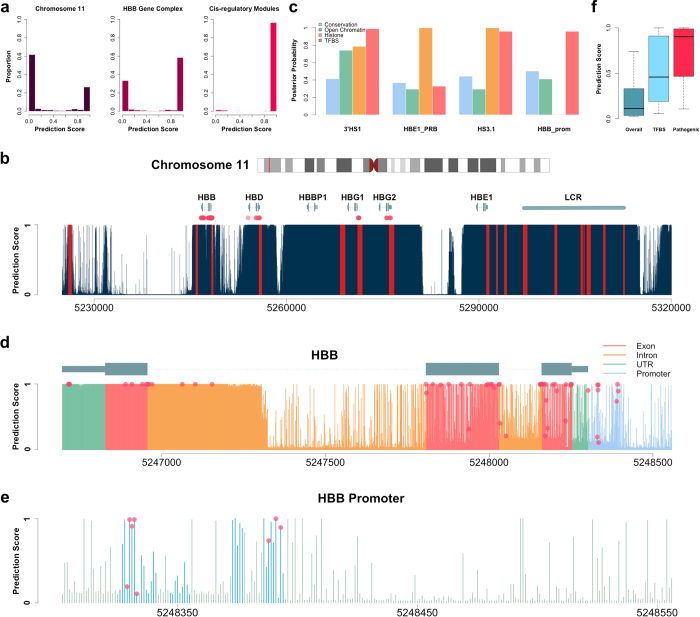
Figure 2.
Functional prediction for the HBB gene complex. (a) Histogram of the prediction scores in chromosome 11, HBB gene complex, and the 23 CRMs. 32.2%, 62.2% and 97.0% are predicted as functional, respectively. (b) Prediction results for the HBB complex. Dark blue bars show the prediction score at each location. All the 23 CRMs are marked in red. There appears to be fewer than 23 red bars because some of the CRMs are very close to each other. Red dots indicate the locations of known pathogenic SNPs downloaded from the NCBI Variation Viewer. (c) The posterior probabilities given a single group of annotations could be used to measure the relative contribution of different sources of information (See Methods). Four CRMs are plotted to illustrate that prediction scores are driven by different annotations in different CRMs. (d) Prediction results for the HBB gene and its promoter. The promoter, UTRs, introns and exons are marked with different colors. Red dots show the prediction scores of the pathogenic variants. (e) Prediction results for the HBB promoter. Known protein binding sites in the HBB promoter are marked in blue. Red dots show the prediction scores of the pathogenic variants. (f) Boxplot of the prediction scores of HBB promoter, known protein binding sites, and pathogenic variants.

