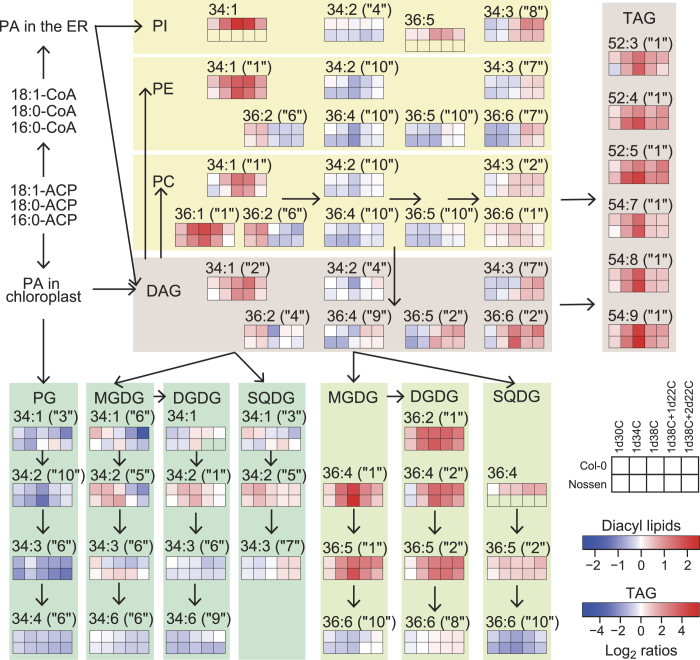
Figure 2. Heat map representation of lipid species in Arabidopsis leaves under heat stress superimposed on a glycerolipid metabolic pathway map.
The average changes in lipid species are shown by 10 boxes (2 rows and 5 columns), which contain 2 genotypes: Col-0 (upper row) and Nossen (lower row); and 5 environments: 1d30C, 1d34C, 1d38C, 1d38C + 1d22C, 1d38C + 2d22C (left-to-right). Heat map colours show the average log2 ratios of fold-changes in each stress condition to the normal 22 °C condition. Due to different induction levels, values of diacyl membrane lipids and TAG are shown by different scales. Samples depicted by boxes with no colour in the Nossen data were not detected. Lipid species belonging to the 10 clusters (Spearman’s correlation coefficients, see Supplementary Fig. S3 for details) are shown with the numbers in parentheses (e.g. “1”, “2”, “6”, “7”, and “10”). Individual experimental data can be found in Supplementary Table S1.

