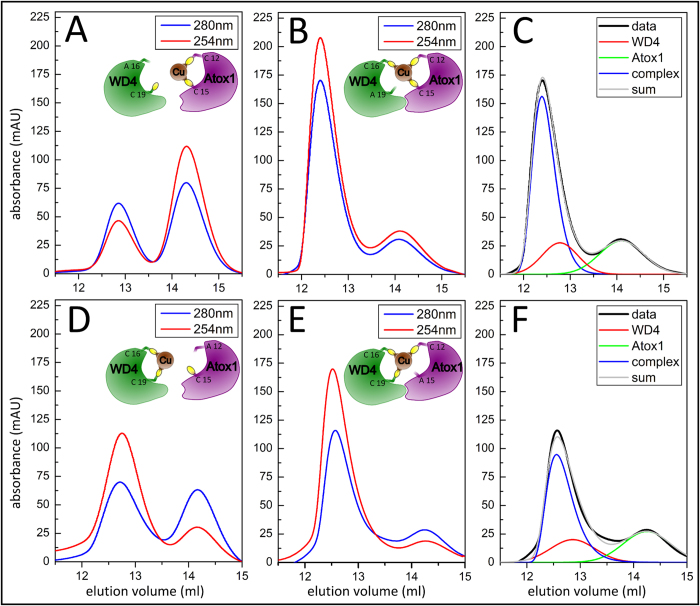
Figure 2. Assessment of protein heterocomplex formation with mutant proteins.
SEC analysis probed by dual wavelength (254 and 280 nm) absorption. (A) WD4A1C2 + Cu+-Atox1: (B) WD4C1A2 + Cu+-Atox1, (D) Cu+-WD4 + Atox1A1C2, and (E) Cu+-WD4 + Atox1C1A2. As depicted in the illustrations in the insets, there is no interaction for A and D, but protein heterocomplexes form in B and E mixtures. (C) and (F): Deconvolution of the 280 nm traces in B and E into 3 components using fityk®: experimental trace data (black; named ‘data’), as well as deconvoluted traces for individual WD4 (red), individual Atox1 (green), the protein heterocomplex (blue), and the sum of the three deconvoluted signals (grey).

