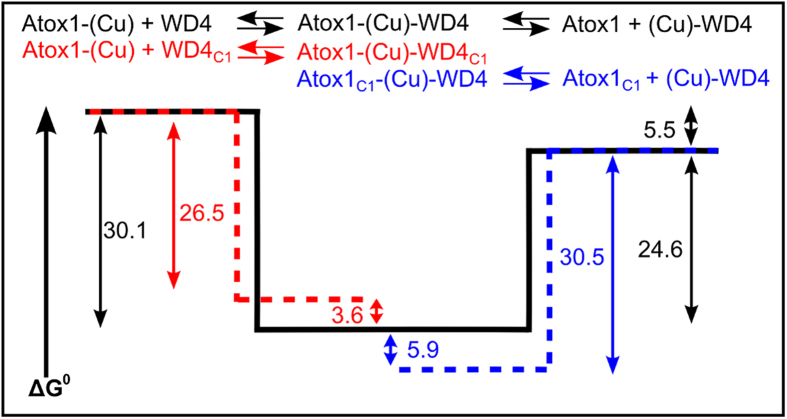
Figure 4. Free energy diagram for Cu+ transfer reaction in.
Figure 1. The reaction between Cu+-Atox1 and WD4C1A2 probes Step 1 (red dashed line), while the reaction of Cu+-WD4 and Atox1C1A2 probes the reverse of Step 2 (blue dashed line). The free energy values for Steps 1 and 2 of the wild type reaction are taken from26 (black line); the values for the mutant reactions are from Table 1. The free energy of the reactants (Cu+-Atox1 and WD4) as well as of the products (Atox1 and Cu+-WD4) in Fig. 1 are assumed to be the same in wild type and mutant reactions (reasonable since the Cu+ in these two samples is bound to the wild type protein). The comparison of free energy values shows that the Atox1C1C2-Cu-WD4C1A2 complex is higher, and the Atox1C1A2-Cu-WD4C1C2 complex is lower, in free energy as compared to the wild type Atox1-Cu-WD4 ensemble.

