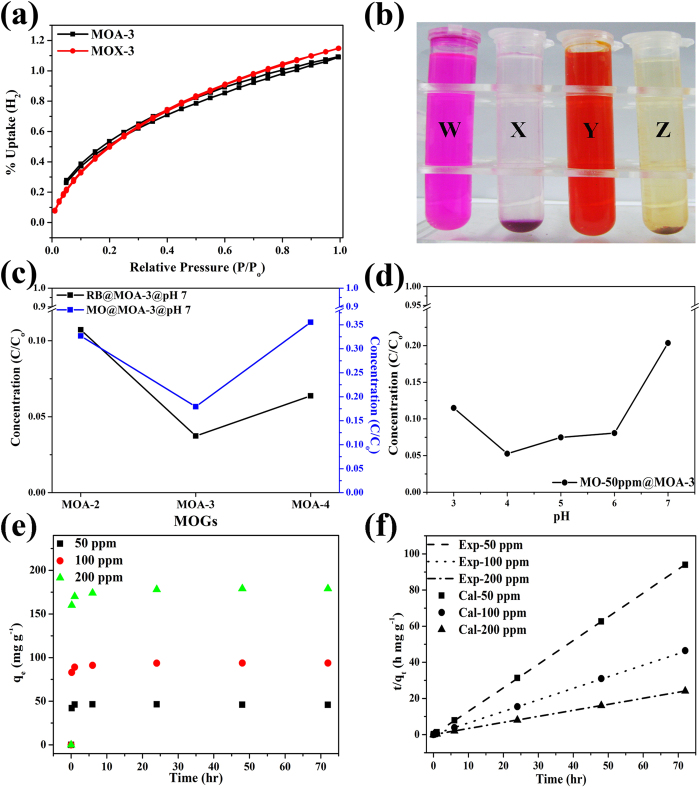
Figure 5.
(a) H2 sorption isotherms of MOA-3 and MOX-3. (b) Adsorption of dye polluted water on MOA-3. W and Y represent polluted waters by dyes (RB and MO) and X and Z represent dye adsorbed solutions on MOA-3 for RB and MO, respectively. (c) Adsorption of dyes on different mixed metal MOGs at neutral pH (d) Adsorption of MO on MOA-3 as function of different pH of solution. (e) Adsorption of different concentrations of MO as function of time and (f) represent second order kinetics of MO adsorption on MOA-3.

