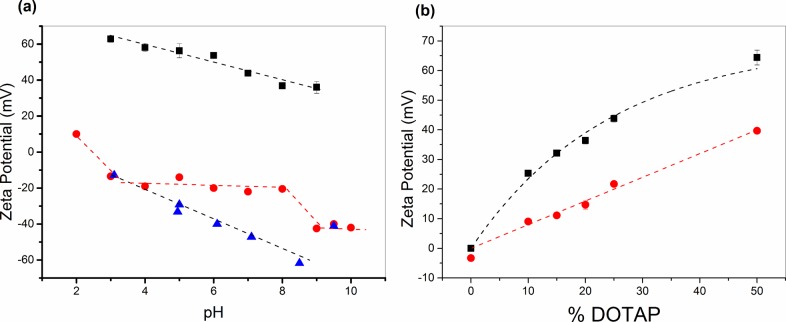
Figure 2.
(a) Zeta potential data obtained for the DOTAP/POPC (25:75) lipid vesicles (black squares) and the PCysMA brush (red circles) as a function of pH. Data for a clean glass surface (blue triangles) for comparison. (b) Zeta potential data for vesicles of varying DOTAP/POPC molar ratios in phosphate buffer at pH 7 (black squares) and in the presence of 140 mM NaCl (red circles). The dotted lines provide a guide to the eye.

