
Figure 3.
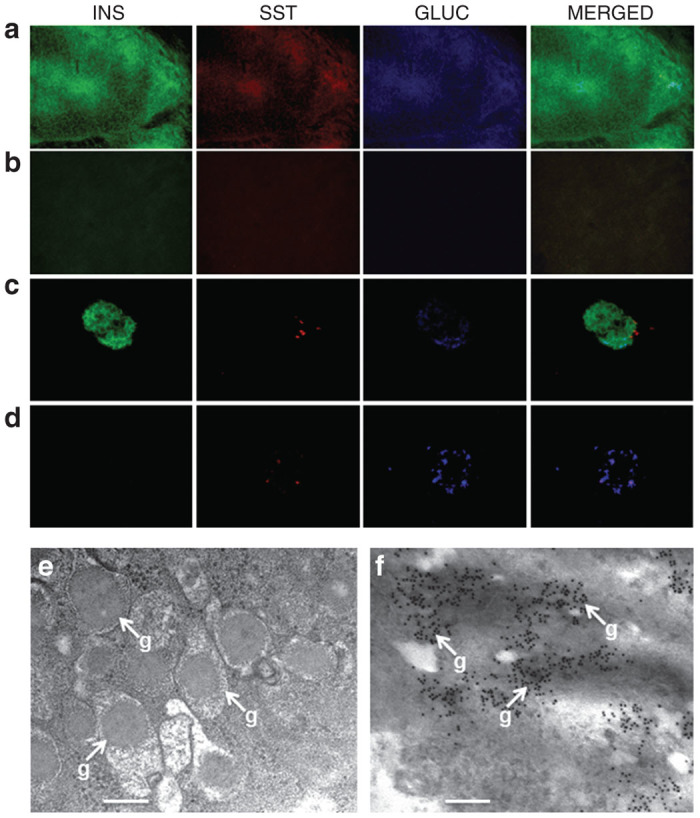
Expression of pancreatic hormones following reversal of diabetes in NOD/scid mice following transplantation of Melligen cells. (a–c) Photomicrographs of triple anti-insulin (INS), anti-somatostatin (SST), and anti-glucagon (GLUC) staining of (a) Melligen graft, (b) normal mouse pancreas, and (c) diabetic mouse pancreas; original magnification, 400×. (d) Transmission electron micrograph showing secretory vesicles with dense granules (g) (bar = 250 nm) in Melligen grafts, 30 days after transplant. (e) Immunoelectron micrograph showing localization of insulin in Melligen grafts, 30 days after transplant (bar = 300 nm).