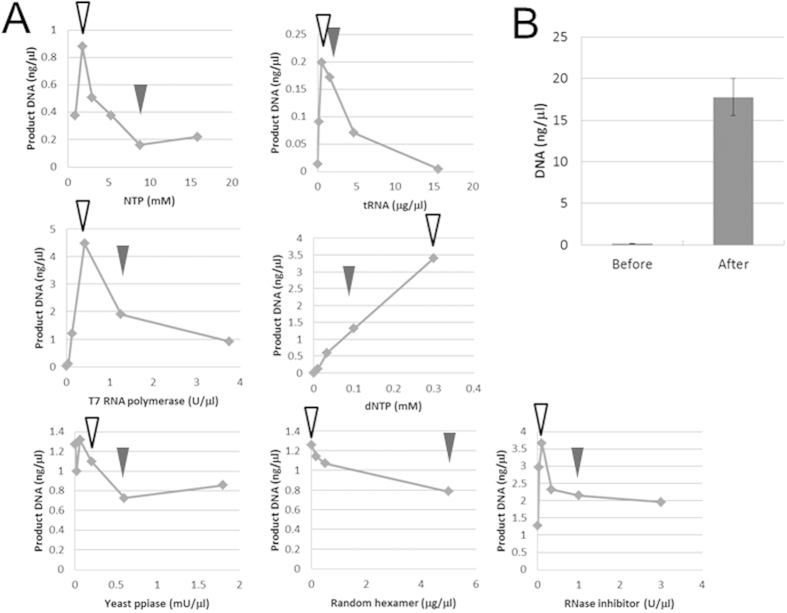
Figure 3. Optimization of the TTcDR system.
A) Optimization of each component in the TTcDR reaction. TTcDR reactions were performed at the indicated concentrations of the various components with circular DNA (1 ng/μl) for 12 h at 30 °C. The amount of DNA product was measured as described in Fig. 2. The original concentrations and the optimized concentrations are indicated by black and white arrowheads, respectively. NTPs include each nucleotide triphosphate (ATP:GTP:CTP:UTP = 3.75:2.5:1.25:1.25) and the same molarity of magnesium acetate. B) Comparison of DNA produced by TTcDR before and after optimization. The TTcDR reaction was performed with 1 ng/μl DNA for 2 h at 30 °C. The compositions before and after optimization are described in the Methods section. The error bars indicate the standard error (n = 14). Original gel images are shown in Figure S2.

