Figure 5.
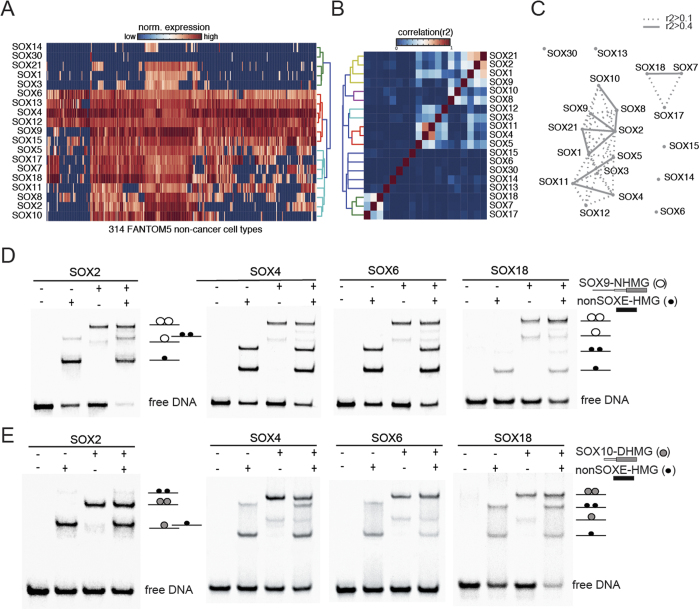
The SOXE-HMG encodes selectivity determinants (A) Expression data for human SOX proteins reported by the FANTOM5 consortium14 was hierarchically clustered in glbase60 showing the widespread co-expression of SOX proteins in many cell types. Expression data were transformed into a correlation heatmap (B) or into a network using r2 correlation coefficients based on the co-expression similarity of SOX genes (C) further illustrating the frequent co-occurrence of SOXE factors (in particular SOX8 and SOX10) but also highlights the correlation of SOXE factors with SOXB family members SOX1, SOX2 and SOX21. Network nodes are SOX TFs and edges are drawn between nodes if the r2 correlation across the FANTOM5 expression dataset is >0.4 (bold lines) or >0.1 (dotted lines). (D,E) The SOX9-NHMG (D) or the SOX10-DHMG (E) was mixed with the HMG boxes of SOX2, SOX4, SOX6 and SOX18 to assess whether SOXE proteins have the capacity to interact with non-SOXE factors. SOX9-NHMG/non-SOXE-HMG heterodimers are barely visible and the SOX9-NHMG or SOX10-DHMG homodimers and non-SOXE-HMG monomers pre-dominate. Non-SOXE-HMG boxes are indicated using black filled circles and the SOX9-NHMG as white circles and the SOX10-DHMG as gray circles in the cartoons marking the microstates to the right of the gel images. A 109aa HMG construct was used for SOX2 and 79aa HMG constructs for SOX4, SOX6 and SOX18 explaining the different mobility.

