
Figure 2.
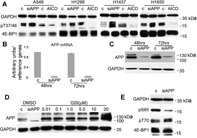
APP depletion causes 4E‐BP1 phosphorylation pattern rearrangements. A: Immunoblot of the specified proteins and phosphoproteins in total cell lysates obtained from the indicated cell lines after transfection with either a control siRNA or control plasmid (c), and cells transfected with siRNA to APP (siAPP) or with a plasmid encoding AICD (AICD). Artificial APP downregulation in NSCLC cells using siRNA: B: Q‐PCR. Columns represent the average of four independent experiments (one in each cell line A549, H1299, H1437, and H1650); bars represent S.D. The mRNA abundance for cells transfected with control siRNA (c) was arbitrarily set to 1 at 48 h after transfection. C: Representative immunoblot at the specified time‐points after siRNA transfection (cell line H1299). Virtually identical results were obtained in all cells tested. For the results shown here we used siRNA to APP 10 (Qiagen). The band visible in siAPP lanes is either non‐specific or, less probably, the highly APP homolog APLP‐2. That band was not affected by GSI treatment, and its intensity or presence was not consistently reproducible in our immunoblots. For these reasons we tend to consider it a non‐specific band. D: Immunoblot of the specified proteins in total cell lysates obtained from cell line H1299 after exposure to the indicated concentrations of GSI. DMSO‐treated cells were transfected with either control (c) or siRNA to APP. E: Immunoblot of the specified proteins and phosphoproteins in total cell lysates obtained from cell line H1299 48 h after transfection with either a control siRNA, or with a siRNA to APP. Similar results were obtained in multiple experiments and in cell line A549.