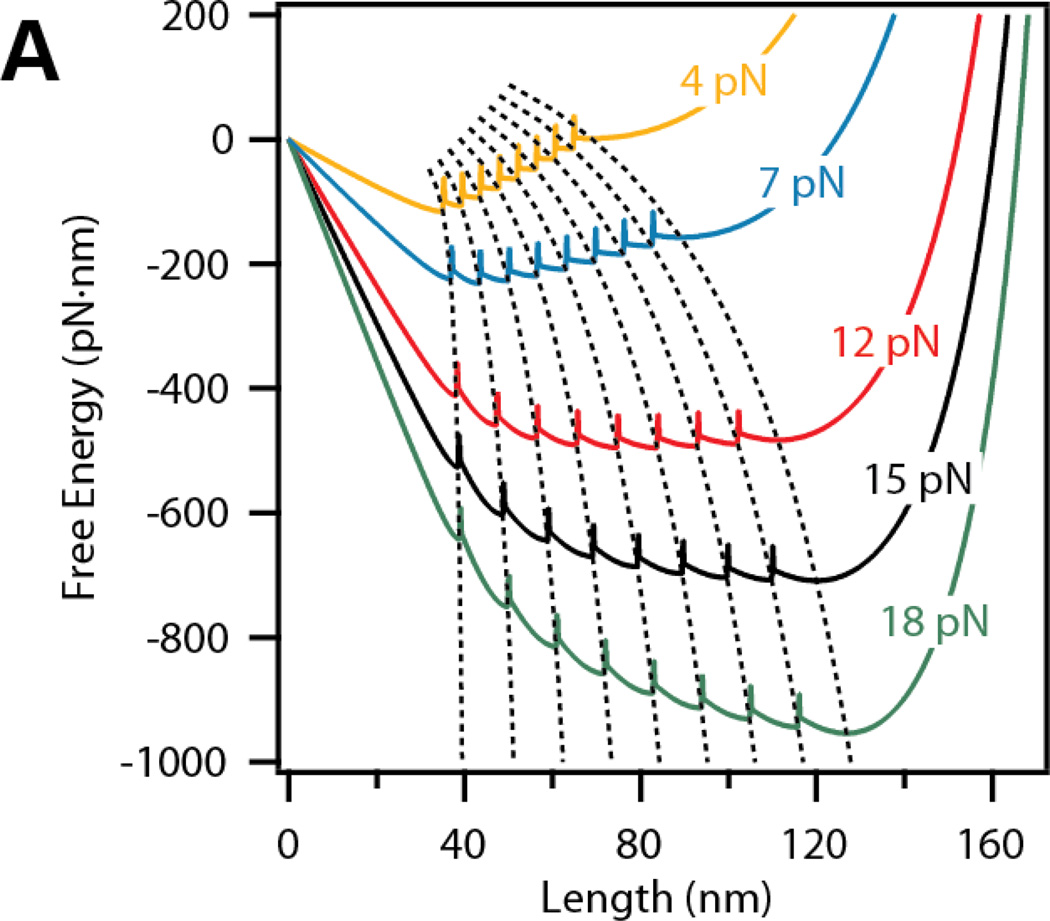
Figure 2. Representation of the E-curves describing the trajectory of the minimum of each domain as a function of force.
The free energy for eight tandem repeats displays nine local minima, corresponding to 0 – 8 unfolded domains. The global minimum of the free energy shifts from 0 domains unfolded to 8 domains unfolded as the force is increased from 4 to 18 pN. E-curves are represented by dashed lines that track the free energy minima through different forces.

