
Figure 4.
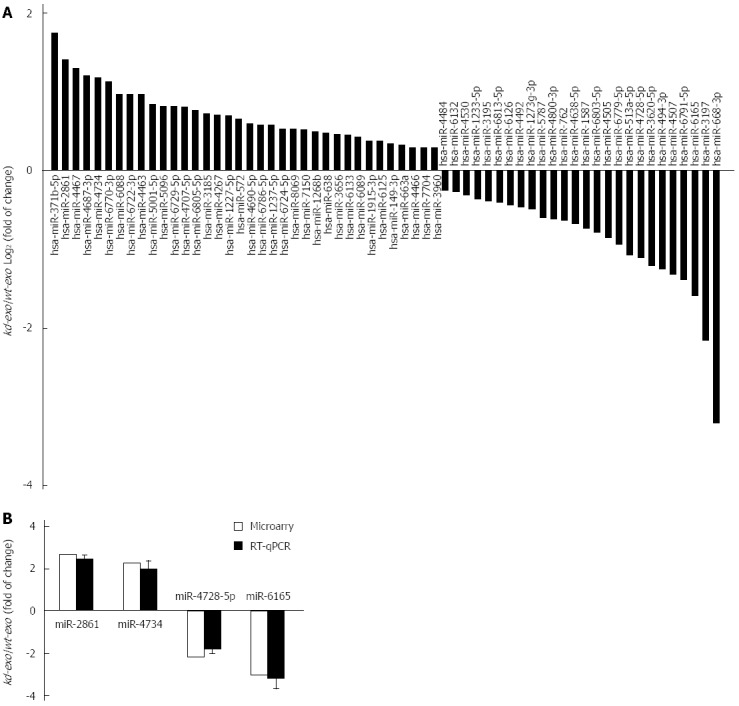
Comparison of miRNA profiles of the two exosomes by microarray analysis and validation of differently expressed miRNAs by RT-qPCR analysis. A: Bar graph showed differently expressed miRNAs in kd-exo by microarray as compared to wt-exo; B: Four miRNAs that displayed either an increased or decreased expression were selected for RT-qPCR validation of microarray assay. The same expression trends were observed between microarray and RT-qPCR for all the miRNAs. wt-exo: SGC/wt-derived exosomes; kd-exo: SGC/kd-derived exosomes.