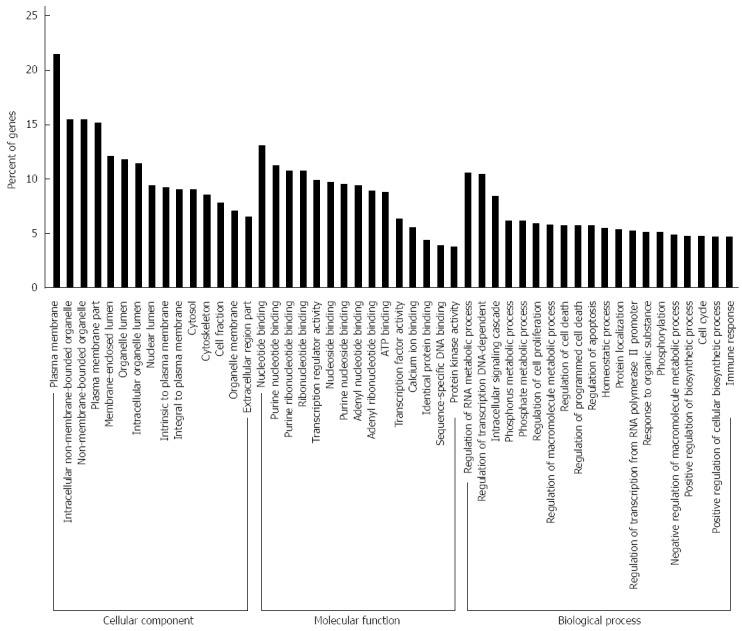
Figure 5.

Gene ontology analysis of the significant predicted genes of differently expressed miRNAs. The results were classified into three main categories: cellular component, molecular function, and biological process. The vertical axis indicated the percent of genes in each category. The horizontal axis is the enrichment of Gene ontology (GO).
