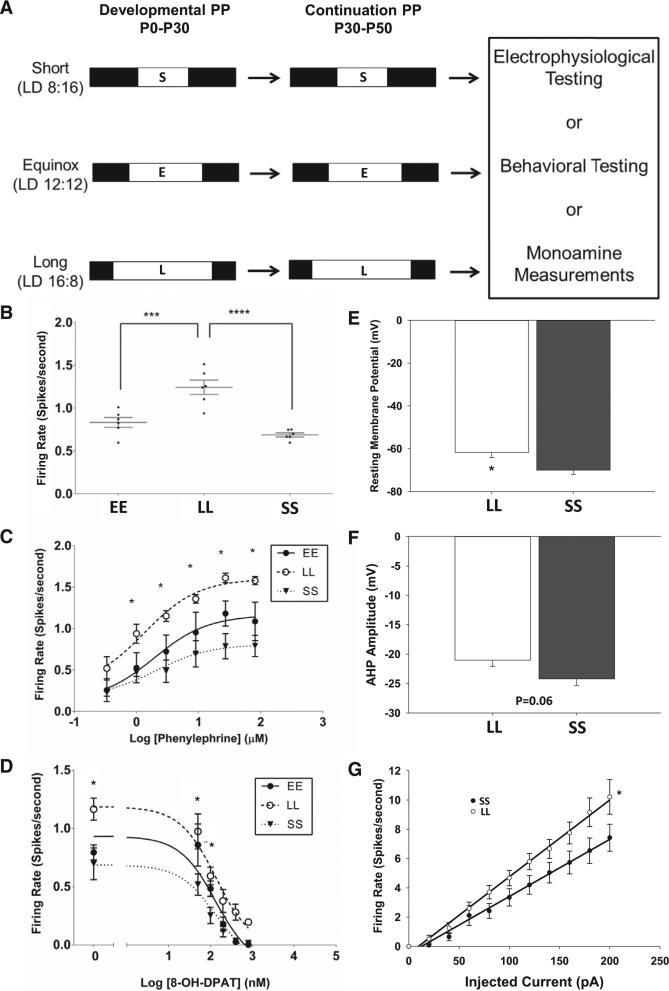
Figure 1. Photoperiod Shapes the Physiological Properties of 5-HT Neurons.
(A) Photoperiod paradigm.
(B) Firing rate of serotonergic neurons in DRN slices from mice exposed to different photoperiods (EE, equinox; LL, long; SS, short; p < 0.001; one-way ANOVA; EE versus LL: adj. p = 0.0005; LL versus SS: adj. p < 0.0001; Holm-Sidak multiple comparison test).
(C) Dose-response curve to phenylephrine (PE). Neurons from LL mice (open circles) display an increased firing rate compared to SS mice (closed triangle) across most doses of PE (1 μM: p = 0.0379; 3 μM: p = 0.0022; 9 μM: p = 0.0023; 27 μM: p = 0.0002; 81 μM: p = 0.0003; mixed design two-way ANOVA with Tukey's MC test) and compared to EE mice at 81 μM (p = 0.0280).
(D) Dose-response curve to 8-OH-DPAT. Neurons from LL mice display an increased firing rate compared to SS mice at baseline and at two doses of 8-OH-DPAT (0 nM: p = 0.0006; 50 nM: p = 0.0008; 100 nM: p = 0.00151; mixed design two-way ANOVA with Tukey's multiple comparison test).
(E) Resting membrane potential is significantly different across photoperiods (p = 0.01 LL versus SS; t test).
(F) After-hyperpolarization amplitude across photoperiod shows a trend toward reduction in long photoperiod (p = 0.06 LL versus SS; t test).
(G) Neurons from LL mice have increased intrinsic excitability compared to SS mice (p = 0.001). Error bars represent the SEM.

