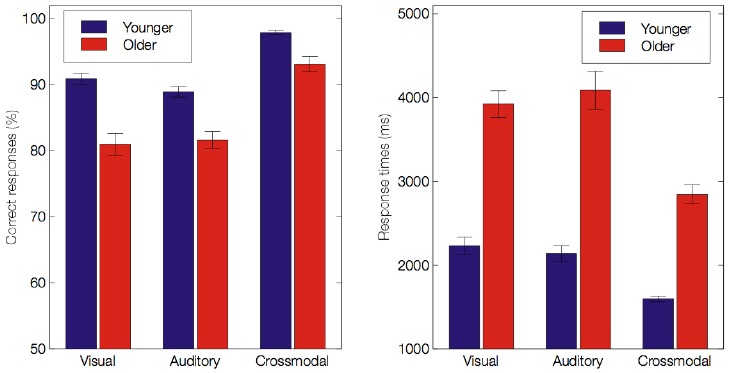
FIGURE 2.

Mean accuracy scores (%) and response times (ms) for both age groups under the visual, auditory and crossmodal conditions. Error bars indicate standard errors of the means.

Mean accuracy scores (%) and response times (ms) for both age groups under the visual, auditory and crossmodal conditions. Error bars indicate standard errors of the means.