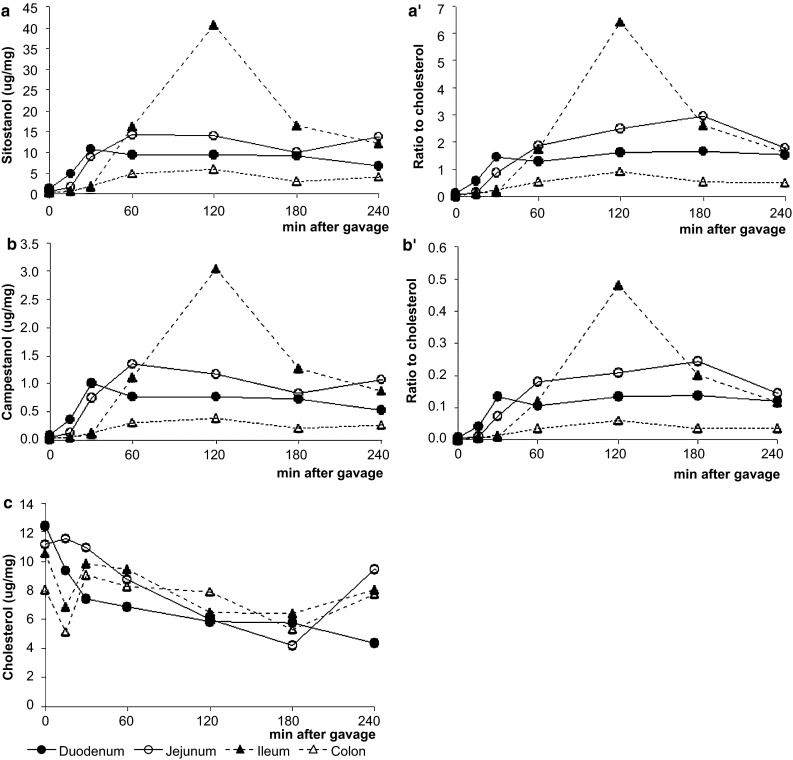
Fig. 1.

Study 1: time kinetics of sitostanol (a, a′), campestanol (b, b′) and cholesterol (c) levels in the intestinal tissue at different time points expressed as absolute value and as a ratio to cholesterol. Values are expressed as means (n = 2 or 3 each)
