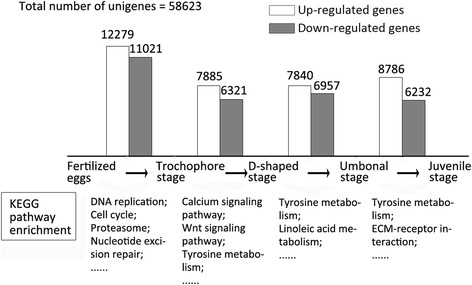
Figure 2.

Transcriptional changes across larval stage transitions. The up-regulated genes refer to those with FC ≥ 2 while the down-regulated genes refer to those with FC ≤ 0.5; KEGG pathway enrichment shows several of those significantly enriched between two consecutive stages (q-value < 0.05), while the whole results could be seen in Additional file 3.
