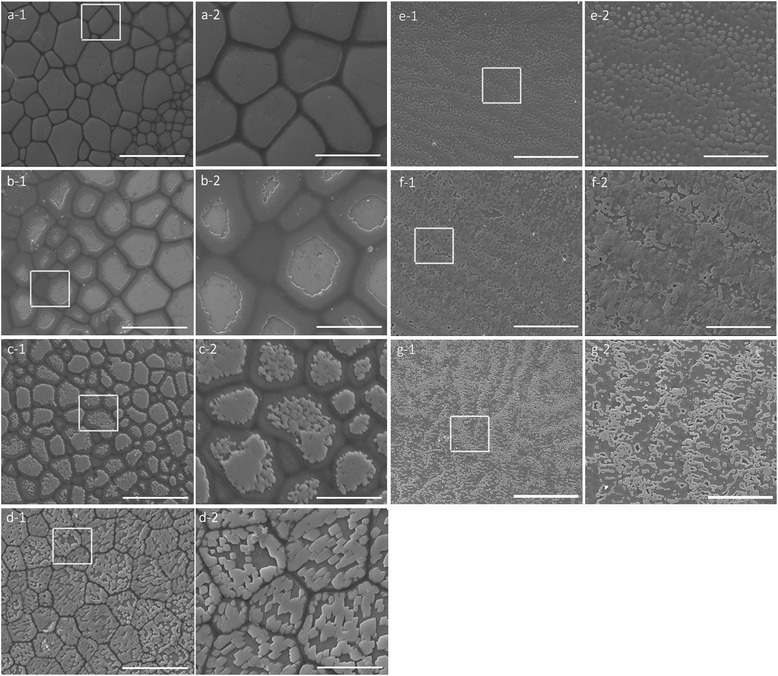
Figure 4.

Effects of the candidate genes on regulating calcium carbonate crystallites on the shell surface. Expression levels of the candidate genes decreased following a dsRNA injection in vivo. (a) Scanning electron microscopic (SEM) images of a normal shell prismatic layer. (b–d) SEM images of the prismatic layers of RNAi knockdown group shells: unigene34354 (b), unigene35118 (c), and unigene51738 (d). (e) SEM images of a normal shell nacreous layer. (f–g) SEM images of the nacreous layers of RNAi knockdown group shells: unigene18749 (f) and unigene56675 (g). a-2 shows an enlargement of the box in a-1, as do b-2–g-2. Bar, 50 μm in a-1, b-1, c-1, d-1, e-1, f-1, and g-1; bar = 20 μm in a-2, b-2, c-2, d-2, e-2, f-2, and g-2.
