
Fig. 5.
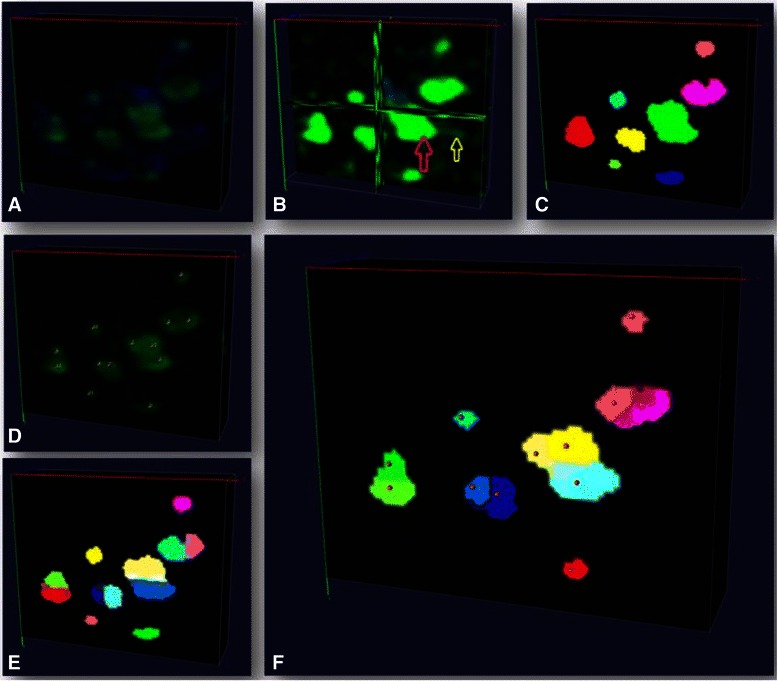
Synapse clump splitting. a Original image with green signal being GABAergic synapse. b Enhanced image with the yellow arrow indicating staining artifacts (dim green signal) and the red arrow indicates synapse clump. c synapse pre-detection (randomly color-coded). d Synapse centers detected using discriminative model; e model-guided splitting to split a clump into two synapses (randomly color-coded). f Example of synapses after iterative model-guided splitting (randomly color-coded). Visualization is done by Vaa3D