Fig. 6.

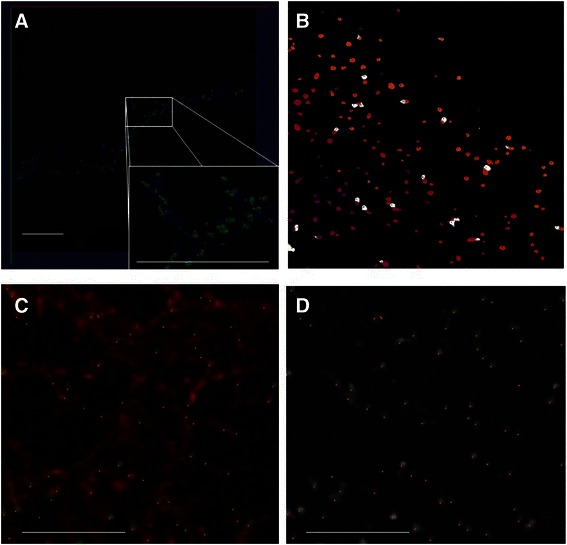
Examples of results of detected synapses for axon and dendrite. a A volume view of synapses on axon terminal. The blue channel is axon morphology, the green channel are GABAergic synapses. Red dots on the zoom-in view are the detected centers of synapes. Scale bar: 10 μm. b the detected synapses after model-guided splitting. The color coding is random. Shown is the maxiumn intensity projection of the 3D view of detected synapses. c Synapses detected on dendrites. Shown is a zoom-in region of primary branch. The red channel is the dendrite morphology by membrane staining. Green channel is GABAergic synapses. Red dots are the detected centers of synapses. Scale bar: 5 μm. d the same region of c but only the synaptic channel is shown. The dots are the detected centers of synapses. Scale bar: 5 μm. Visualization is done by Vaa3D a, c, d and ImageJ b
