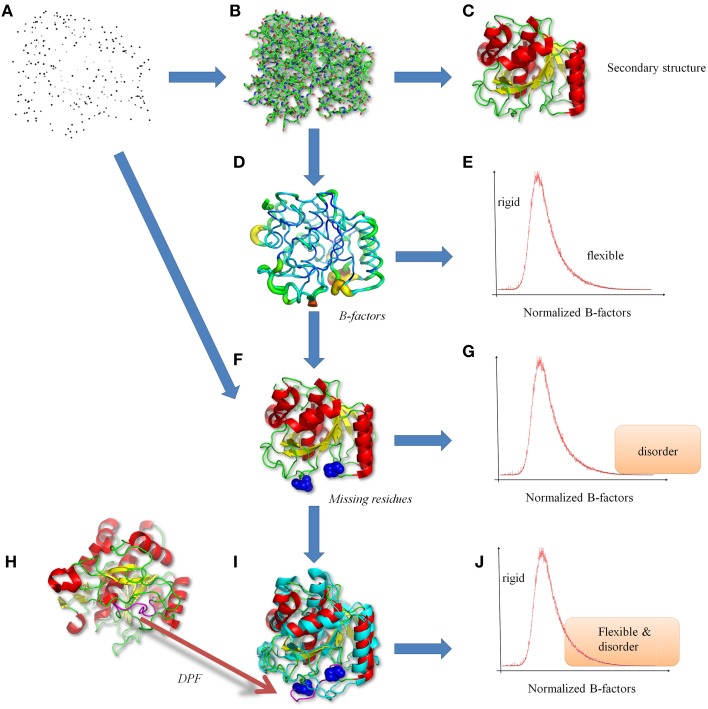
Figure 1.
Classical views of protein structures. (A) The protein structure is a file in PDB format (Bernstein et al., 1977; Berman et al., 2000), containing the 3D atomic coordinates. (B) The atoms are bound to build the protein backbone and side-chain residues. (C) From this information, secondary structures are performed (Kabsch and Sander, 1983). (D) From crystallographic data, B-factors are analyzed underlining (E) rigid to flexible residues. (F) More precise analyses shows missing residues revealing. (G) disorder regions (Uversky et al., 2000; Dunker et al., 2001). (H) Interestingly same or similar proteins can be found in the PDB (Berman et al., 2000), and (I) in numerous times with the missing regions resolved, leading to (J) a more complex definition and an ambiguity between flexibility and disorder. Protein visualization was created by the program PyMOL (http://www.pymol.org, Delano, 2013). The proteins used are two proteases (PDB codes 1dbi chain A, and 1wmd chain A, for this last only residues 1–306 are shown for more clarity).

