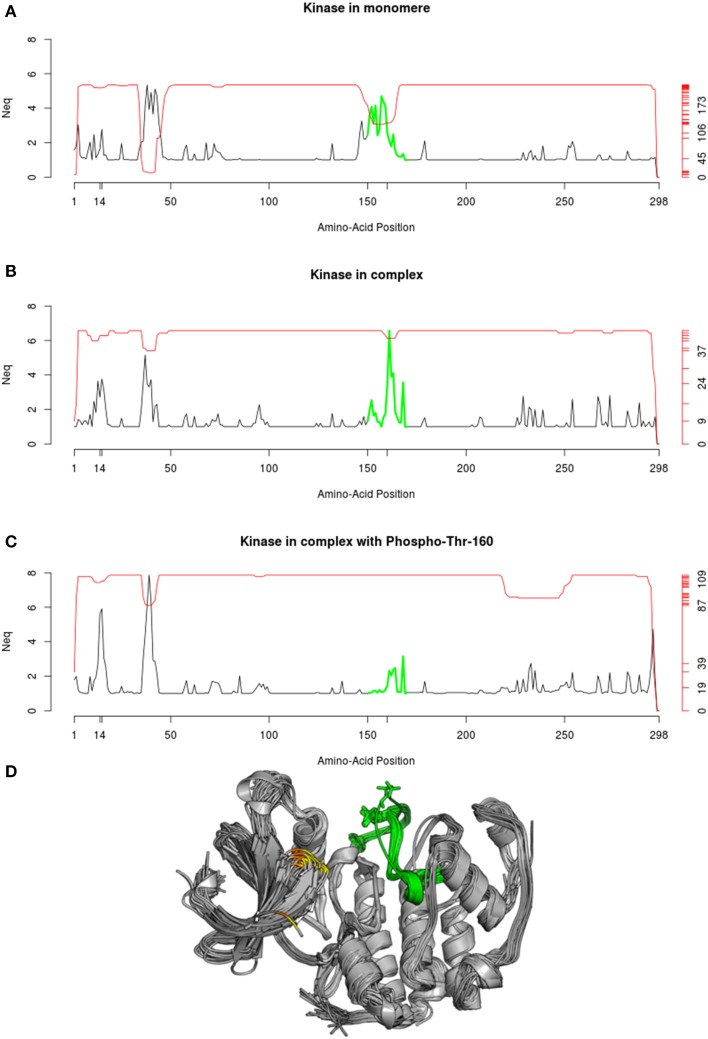
Figure 11.
Neq profile of Cyclin-dependent kinase 2. The Neq profile is given in each case: (A) for structure of kinase found in monomer, (B) found as part of a complex, (C) found in complex with a phosphorylation solved in the Thr-160. (D) The superposition of the 112 PDB chains used to compute the Neq profile in (C) is shown. The corresponding green region is highlighted, and positions 14 and 15 are, respectively, indicated in yellow and orange. Protein visualization was created by the program PyMOL (http://www.pymol.org, Delano, 2013).

