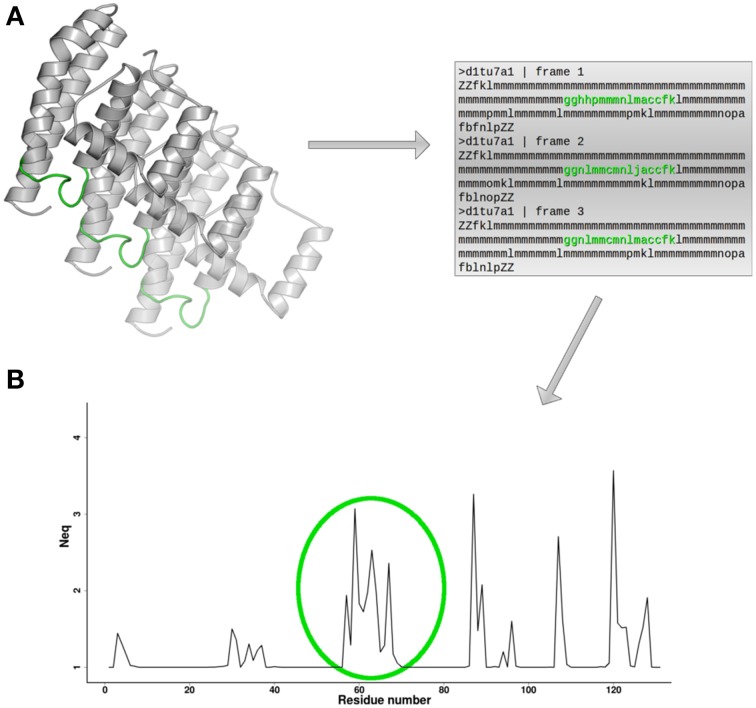
Figure 3.
Neq and local flexibility. (A) For each conformation extracted from MD simulation, a PB sequence is assigned. (B) Neq profile provides direct identification of protein fragments in which local conformational change is observed. Here, in green, is indicated a flexible loop. The protein 3D structure representation is generated using PyMOL software (http://www.pymol.org, Delano, 2013).

