Figure 5.
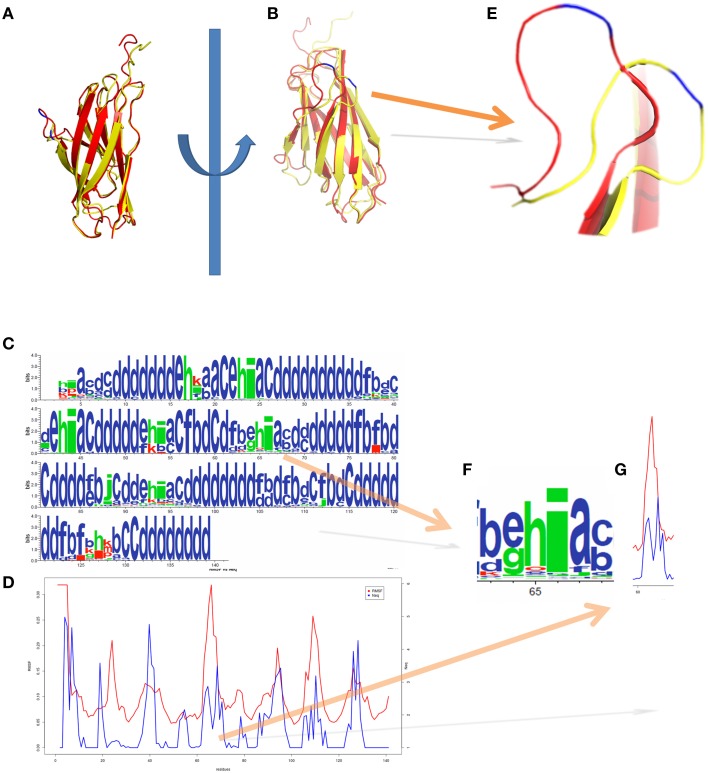
Integrin Calf-1 domain simulation using PBxplore. (A,B) show the superimposition of two distinct snapshots (in red and in yellow) extracted from a molecular dynamics. (C) Shows the PB distribution in terms of WebLogo (Crooks et al., 2004) obtained thanks to PBxplore, and (D) represents the superimposition of Neq and RMSF for the whole domain. (E) Zoom on the loop containing the residue 66 of Cab-1 domain (blue) which shows a dedicated (F) PB pattern i with a (G) low Neq and high RMSF, i.e., a mobile position in a “flexible” region. Visualization was created by the program PyMOL (http://www.pymol.org, Delano, 2013).

