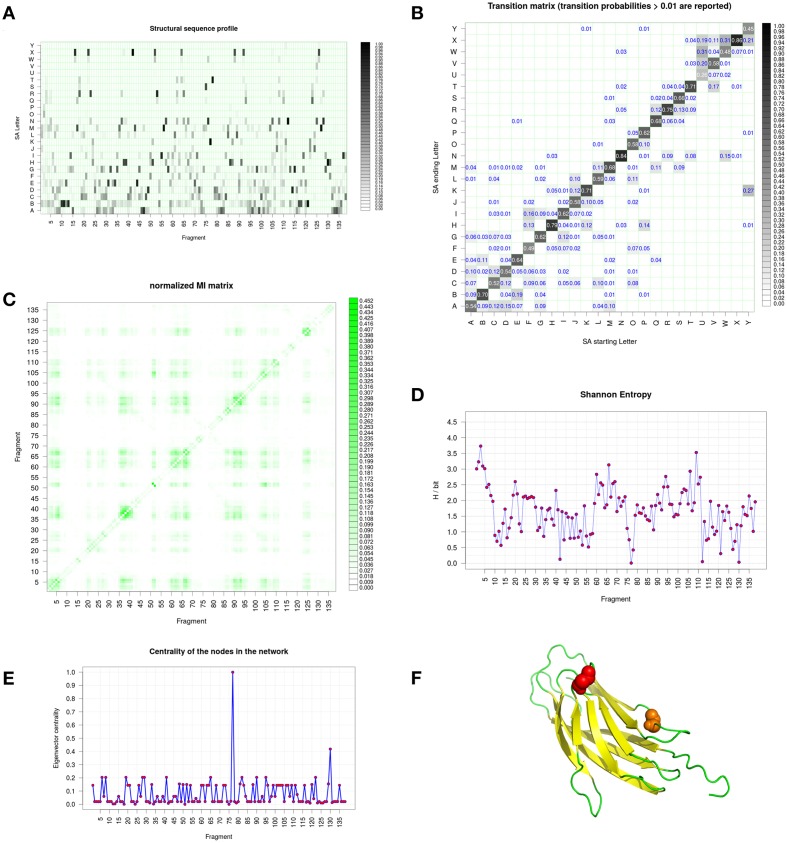
Figure 6.
Integrin Calf-1 domain simulation analyses using GSATools. (A) shows the structural alphabet distribution during the simulation, i.e., the sequence profile of the alignment, (B) the transition probability matrix for the transitions between SA letters, which reflect local conformational changes, (C) the Mutual Information (MI) matrix describing the correlation of local conformational changes among the protein's fragments, (D) the Shannon entropy per position, and (E) the graph representation of the correlated local motions from the MI matrix, with the eigenvector centrality, which describes the relative importance of the nodes in the network. (F) Is a visualization created by the program PyMOL (http://www.pymol.org, Delano, 2013) of the two most important peaks underlined by (E).

